- Ethereum price nursing losses in second half of the session on Friday, down some 1.60%.
- ETH/USD was saved by further downside by an ascending trend line. This has been running since the bounce on 31st October.
- The above-mentioned ascending trend line, sees the 50% Fibonacci in proximity.
ETH/USD 4-hour chart
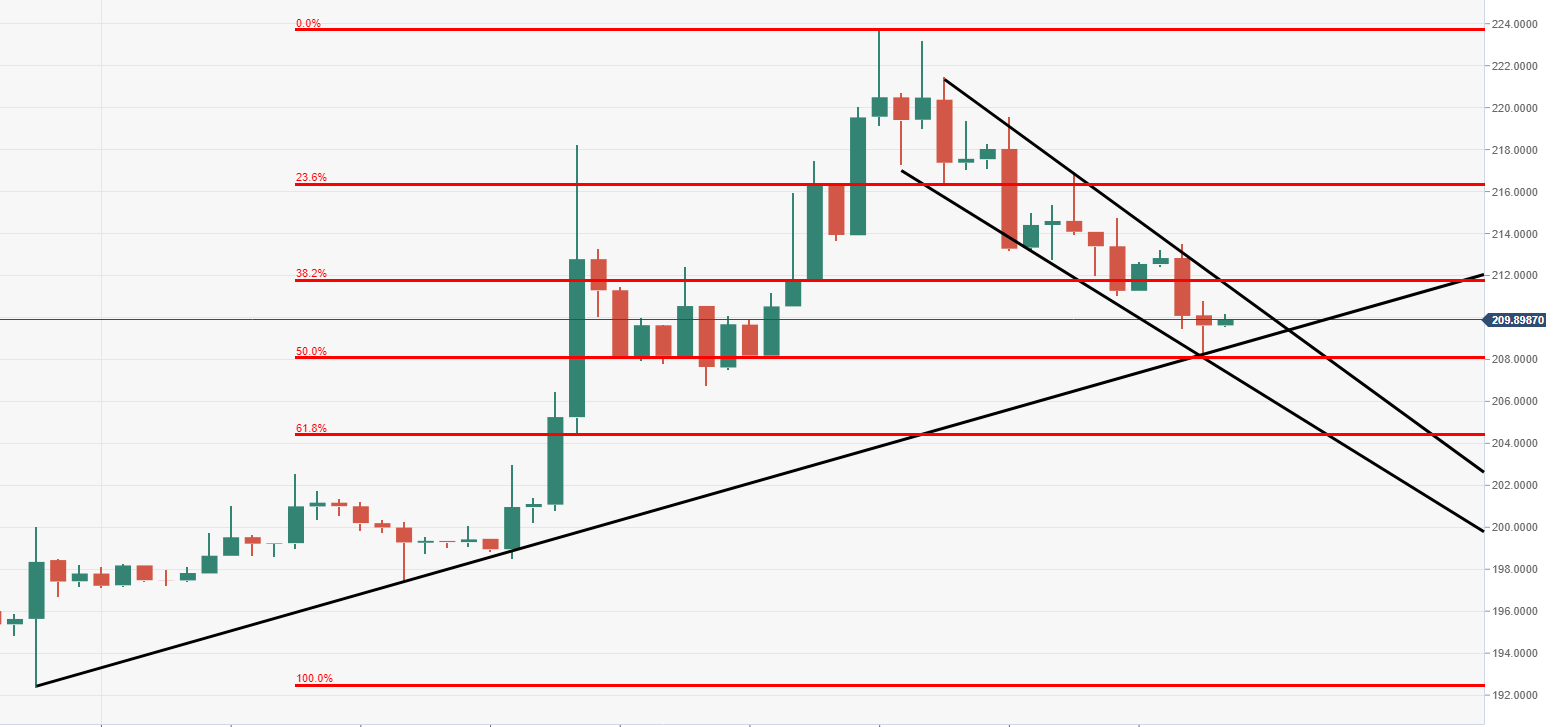
Spot rate: 209.64
Relative change: -1.60%
High: 213.52
Low: 208.11
Trend: Bearish.
Support 1: 208.11, ascending trend line & 50% Fibonacci.
Support 2: 204.37, 100DMA & 61.8% Fibonacci.
Support 3: 192.42, 31st October.
Resistance 1: 211.76, 38.2% Fibonacci.
Resistance 2: 216.31, 23.6% Fibonacci.
Resistance 3: 223.66, 7 November high.
