- Ethereum price on Friday was down around 2.5% in the second half of the session.
- ETH/USD bears are flirting vigorously with a vital near-term demand area. Lower end of this support seen at $165.
- Price action has formed a bearish flag pattern, as eyed on the daily view.
- Ethereum earlier in the week, lost its 2nd place of largest cryptocurrency by market cap to Ripple’s XRP.
ETH/USD daily chart
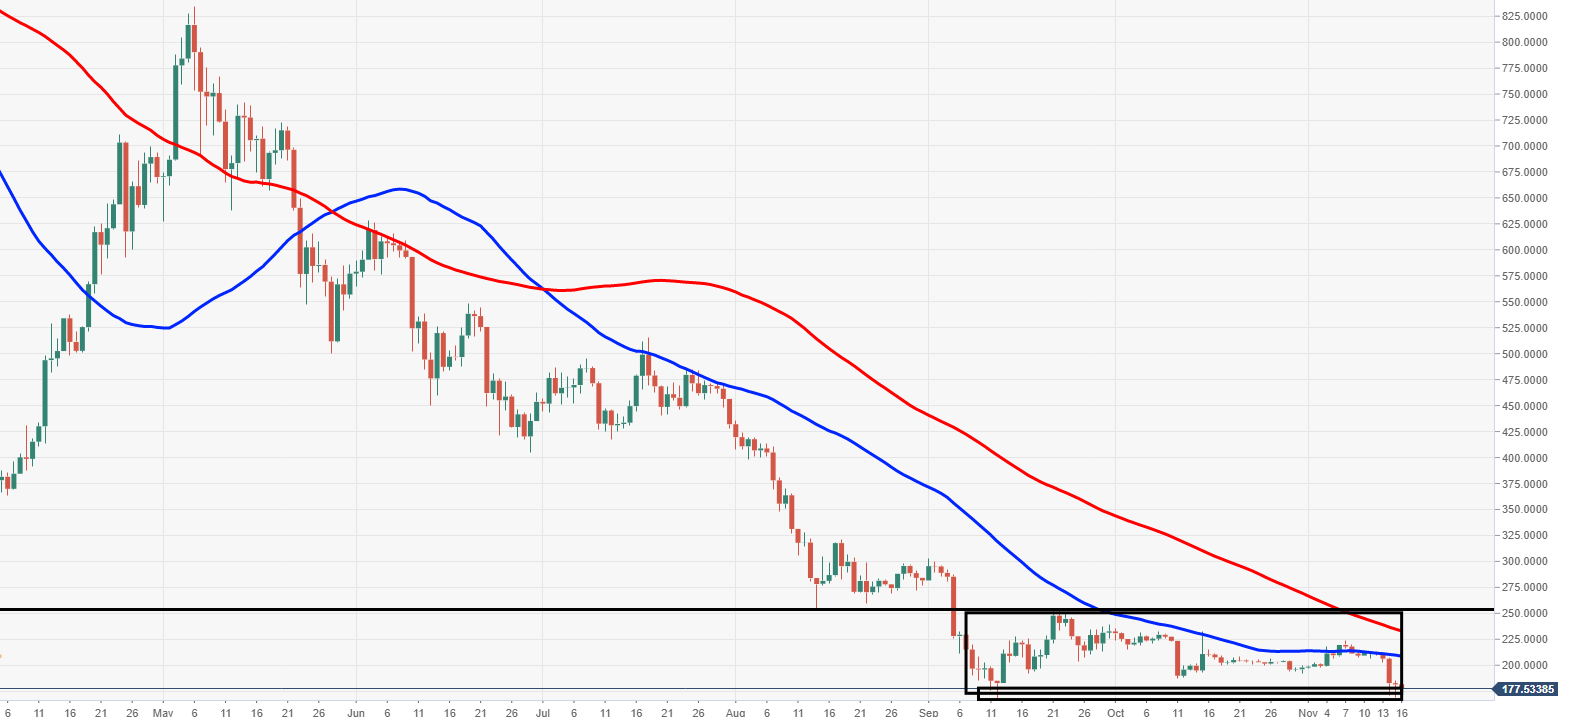
Spot rate: 177.85
Relative change: -2.51%
High: 181.82
Low: 174.92
Trend: Bearish
Support 1: 171.52, daily pivot point support.
Support 2: 161.46, daily pivot point support.
Support 3: 154.38, daily pivot point support.
Resistance 1: 188.67, daily pivot point resistance.
Resistance 2: 195.75, daily pivot point resistance.
Resistance 3: 205.81, daily pivot point resistance.
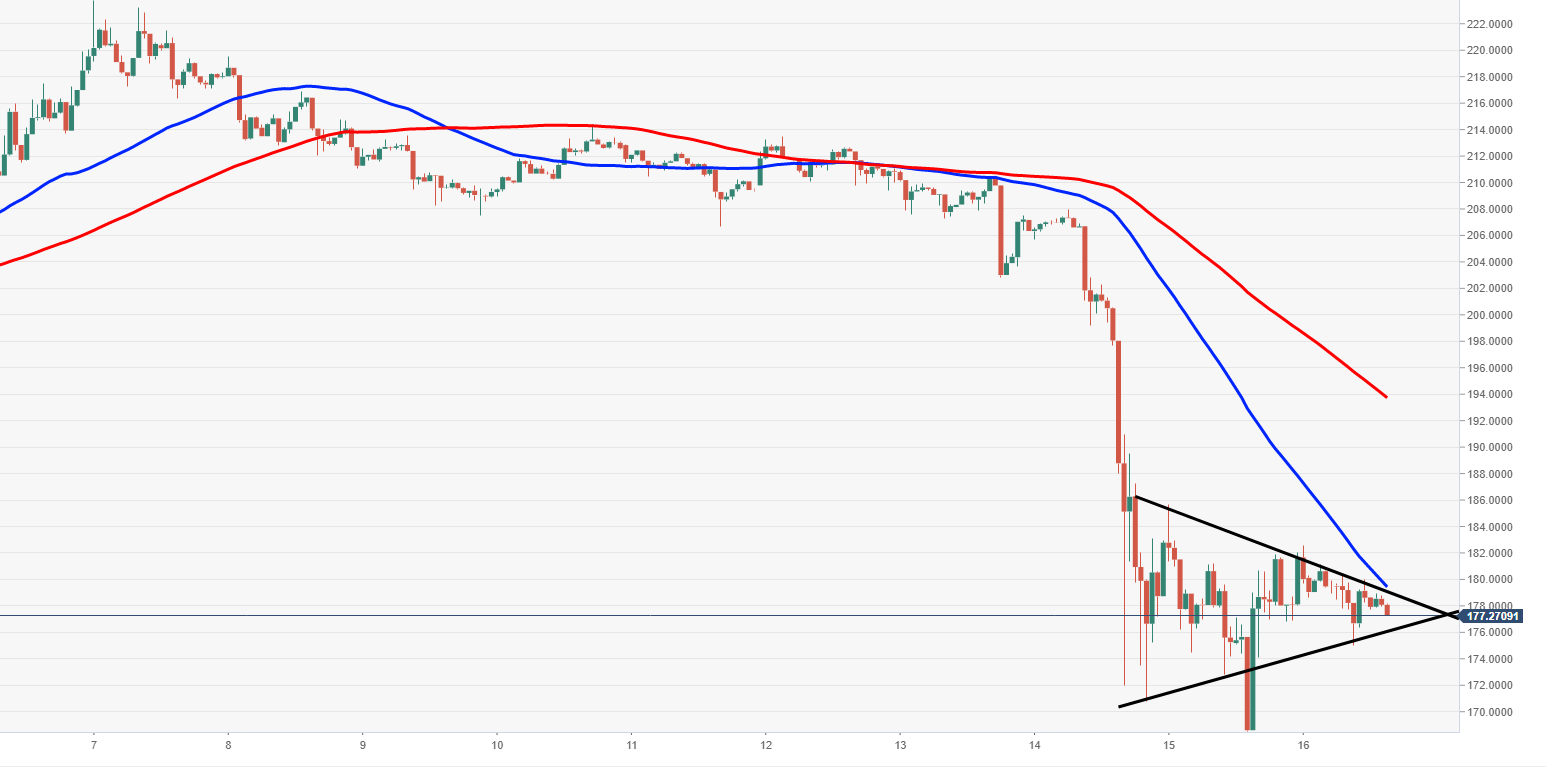
ETH/USD 60-minute chart
- A bearish pennant formation has been eyed via the 60-miunte chart view, subject to a potential extended breakout to the downside.