- Bitcoin price nursing minor losses of some 0.7% in afternoon trading Wednesday.
- BTC/USD via the 60-minute chart view, is in the process of a possible head and shoulders pattern formation.
- Weekly support around the $4000 mark has continued to serve. Further south, eyes would be on $3000, September 2017 low.
- Price heading closer to oversold territory, looking at the RSI on the weekly view.
BTC/USD 60-minute chart
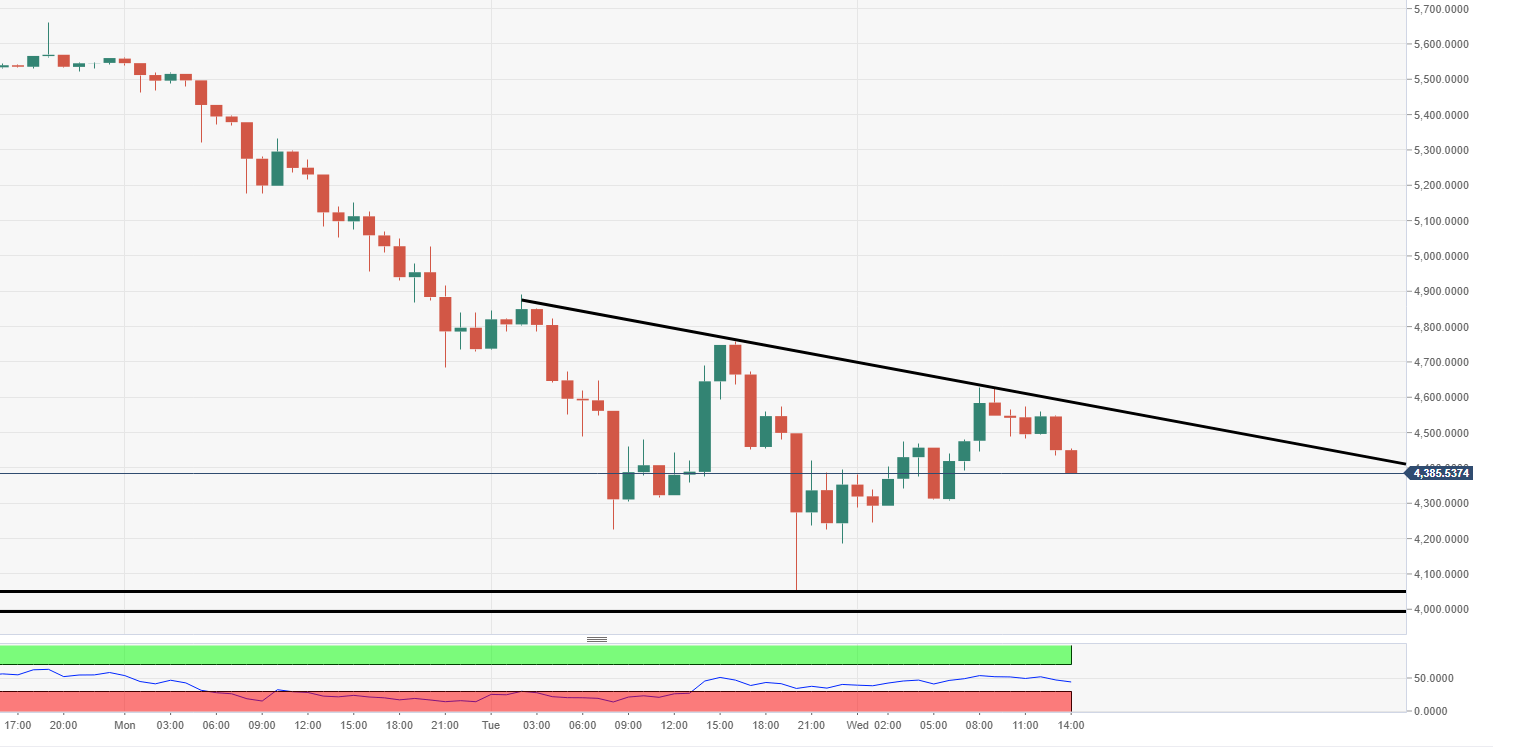
Spot rate: 4397.15
Relative change: -0.70%
High: 4637.55
Low: 4246.99
Trend: Bearish
Support 1: 4054.50, 60-minute support & possible neckline.
Support 2: 4000.00, weekly support.
Support 3: 3050.00, September 2017 low & weekly support.
Resistance 1: 4580.95, upper descending 60-minute trend line.
Resistance 2: 4812.15, daily pivot point resistance.
Resistance 3: 5271.43, daily pivot point resistance.
BTC/USD weekly chart
- Vital support of $4000 still in the picture, further south would see $3050 support in view, September 2017 low.

