- Bitcoin Cash is trading in negative territory by 0.80% in the latter part of Thursday.
- BCH/USD price action broke out to the upside from an inverted head and shoulders pattern.
BCH/USD 15-minute chart
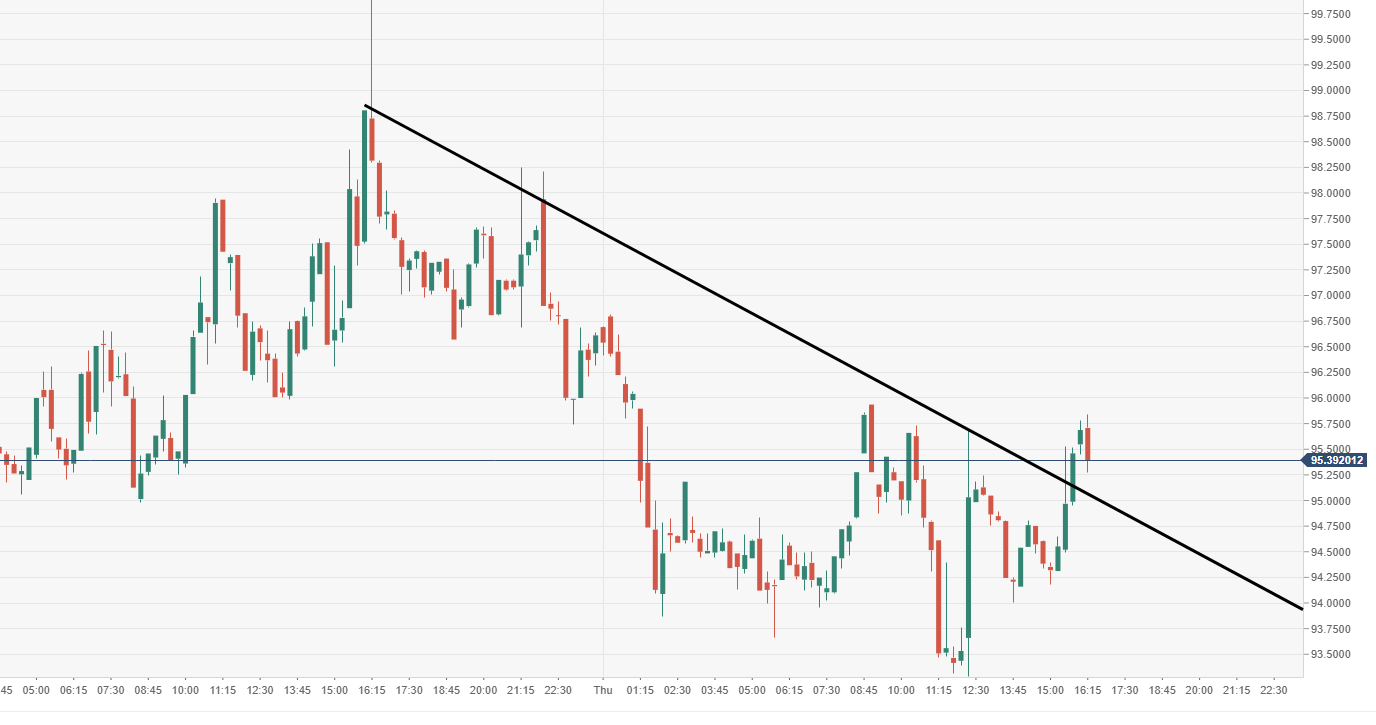
Spot rate: 95.47
Relative change: -0.85%
High: 95.93
Low: 93.28
Trend: Bearish
Support 1: 95.04, breached descending trend line.
Support 2: 93.96, daily pivot point support.
Support 3: 91.31, daily pivot point support.
Resistance 1: 99.58, daily pivot point resistance.
Resistance 2: 102.55, daily pivot point resistance.
Resistance 3: 105.20, daily pivot point resistance.
BCH/USD 60-minute chart
- Price action moving within a horizontal wedge pattern as seen via the 60-minute chart view.

BCH/USD daily chart
- Movement via the daily time frame is almost lifeless, an extremely narrow range.

