- Bitcoin Cash price jumped as much as 76% in the session on Thursday. Seen up over 45% in the latter part of the day.
- BCH/USD bulls will be gunning for upside targets of; $205, $250, $410 and $650.
BCH/USD 15-minute chart
- After the price cooled, the bulls have forced a breach from a descending wedge pattern.
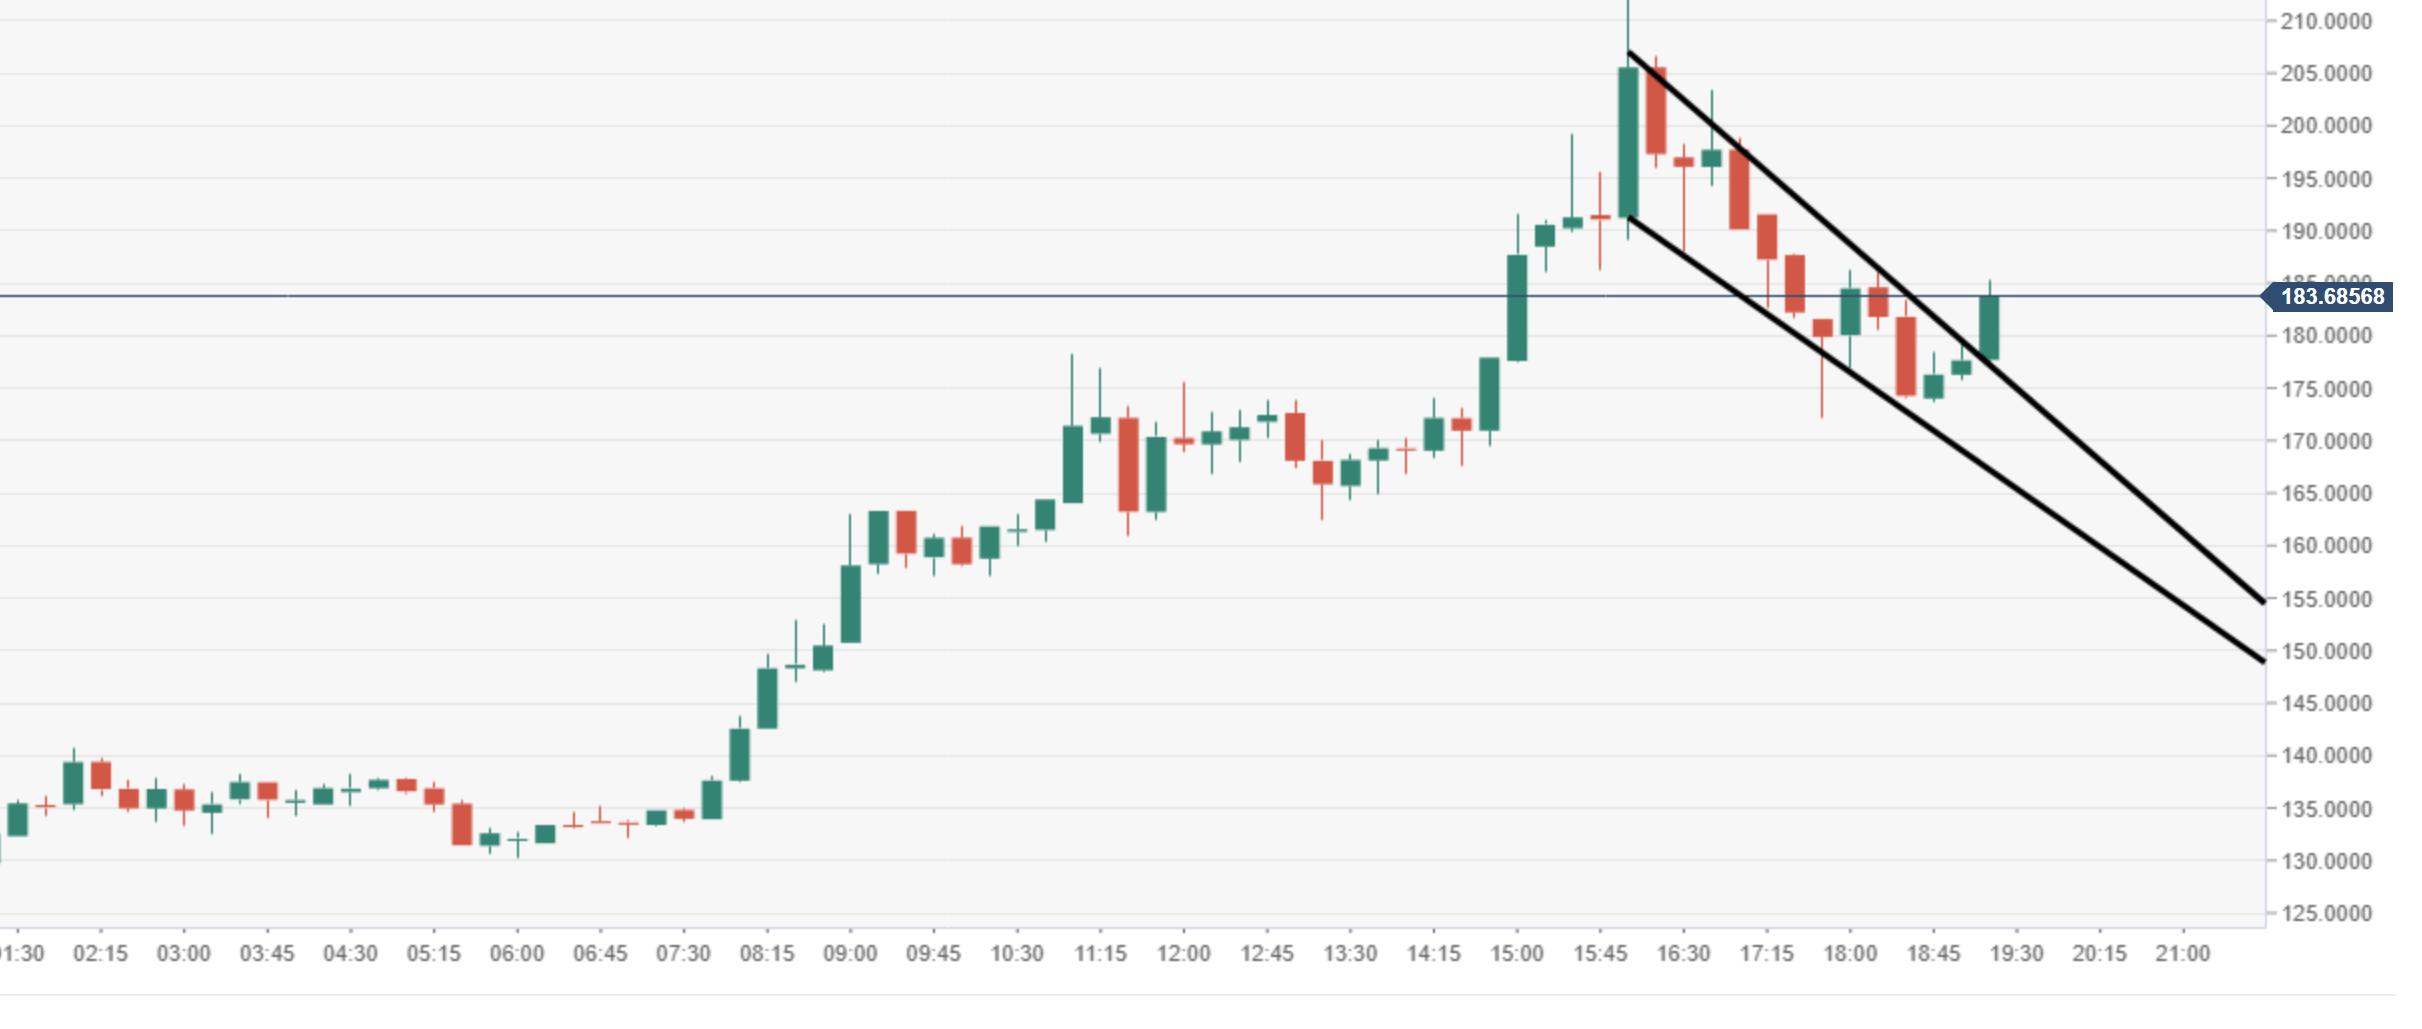
Spot rate: 184.45
Relative change: +46.55%
High: 213.40
Low: 123.85
Trend: Bullish
Resistance 1: 192.06, daily pivot point resistance.
Resistance 2: 205.00, daily resistance area.
Resistance 3: 250.00, daily resistance area.
Support 1: 146.80, monthly low.
Support 2: 103.34, daily pivot point support.
Support 3: 80.42, daily pivot point support.
BCH/USD 60-minute chart
- $150 was a big price area for BCH/USD, the bulls broke out, triggering stops to the upside, sending it flying.

BCH/USD daily chart
- The next areas of interest for the bulls are; $205, $250, $410 and $650, these are all potential barriers to the upside.

