- Bitcoin starts the week’s trading strong as it holds grounds above $4,000.
- The asset records incredible gains in two weeks as trading volume surge.
- BTC/USD is likely to correct above $4,100 but $4,200 is out of reach.
Bitcoin bulls ended last week strongly with gains over the weekend zooming past $4,000. Moreover, the asset is still maintaining its position above the same level, although it was the bullish trend failed to break above $4,100.
According to the data on CoinMarketCap, the largest crypto by market capitalization is still trading in the green with gains of 4.89% in the last 24 hours. Bitcoin’s 24-hour trading volume has increased considerably over the last few days as well from $4.5 billion on January 3 to the current $5.7 billion. The market cap has also corrected higher from $66 billion to $70 billion at the time of writing in the same period.
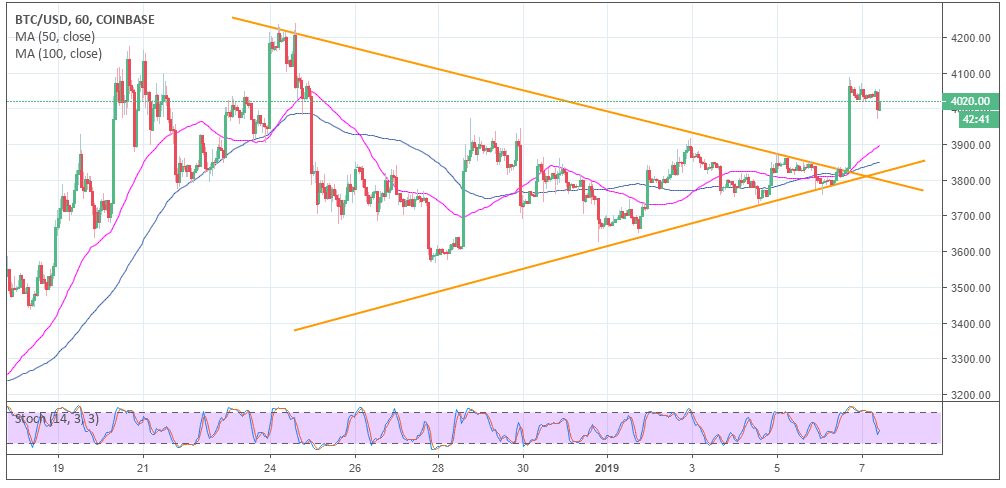
Prior to the breakout that kicked off around $3,800, Bitcoin price had formed a contracting triangle in the 1-hour range as observed in the chart following the retracement from the recent high at $4,200. On the downside, the bulls found refuge at $3,600. The price traded in sideways consolidation with the upside capped at $3,900. However, the contracting triangle saw BTC/USD spring up in an engulfing candle that blasted past the resistance at $3,900 and claimed position above $4,000. In addition, the bull move zoomed above $4,100 forming a 2-weeks high around $4,086.
Presently, Bitcoin is trading at $4,021.23 and is embracing the support we mentioned in the earlier analysis at $4,020. As per the status on the chart, BTC/USD is likely to correct above $4,100 but $4,200 is out of reach, at least for now. Besides, the above support $4,000 is a resistance turned support while the 100-day Simple Moving Average (SMA) at $3,900 is the next support zone. Other vital support levels include $3,800 and $3,600 respectively.
BTC/USD 1-hour chart