- Litecoin price on Friday is trading down in the second half of the session, some 1.8%.
- LTC/USD price action has extended to the downside, through the ascending trend line support.
LTC/USD 15-minute chart
- Price action moving within a narrow range-block formation, subject to a further break lower.
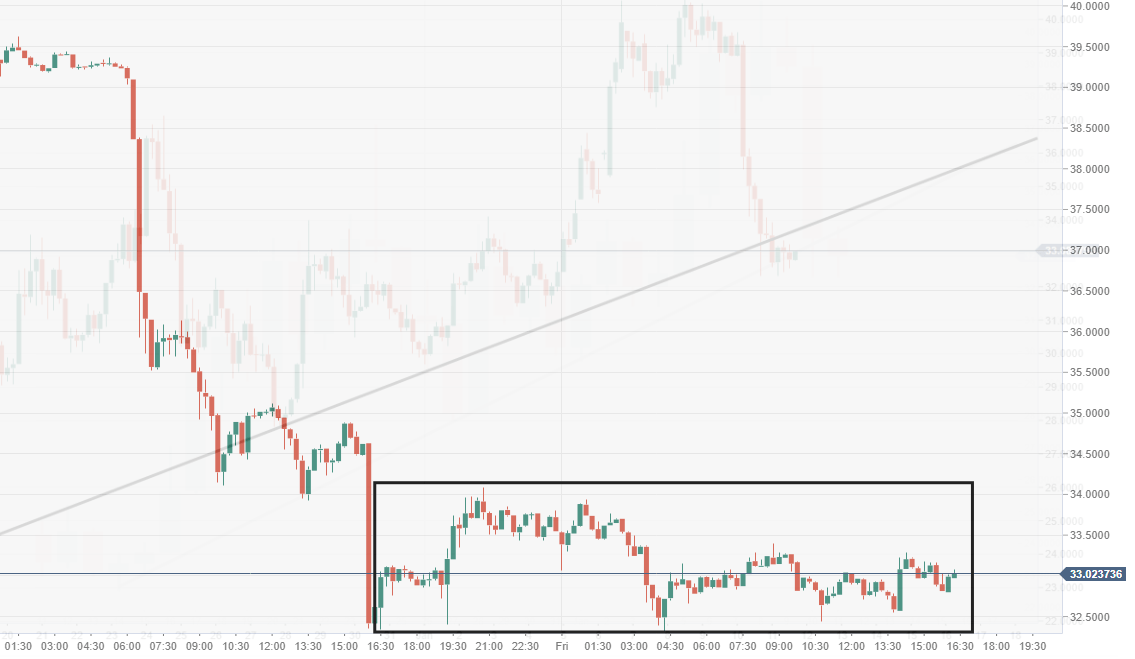
Spot rate: 33.04
Relative change: -1.80%
High: 33.93
Low: 32.31
Trend: Bearish
Support 1: 30.71, daily pivot point support.
Support 2: 27.88, daily pivot point support.
Support 3: 23.43, daily pivot point support.
Resistance 1: 37.99, daily pivot point resistance.
Resistance 2: 42.45, daily pivot point resistance.
Resistance 3: 45.28, daily pivot point resistance.
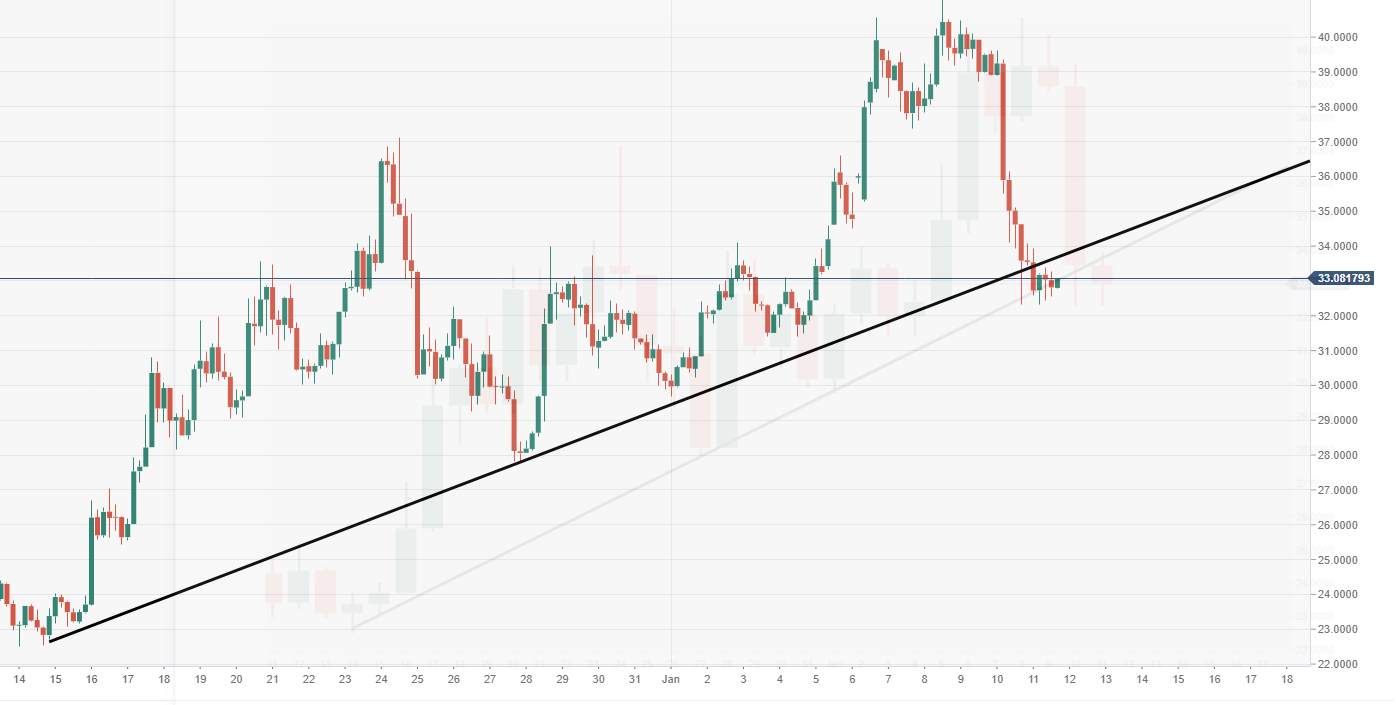
LTC/USD 4-hour chart
- LTC/USD price broke-out and retested the long-running ascending trend line. The price is hugged fairly tightly to this.
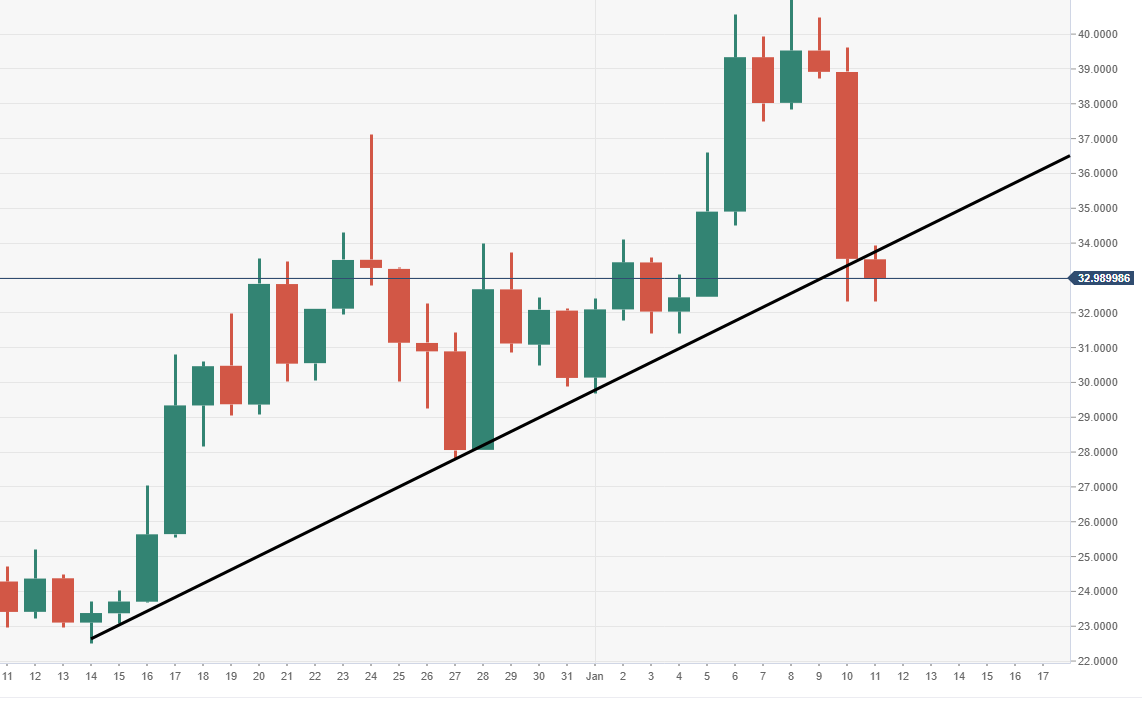
LTC/USD daily chart
- Pressure remains to the downside after a breach of key ascending trend line.