- Bitcoin price on Tuesday was seen trading in minor positive territory, holding minor gains of just 0.40%.
- BTC/USD price action moving within a descending channel formation via the daily, subject to a potential bullish breakout.
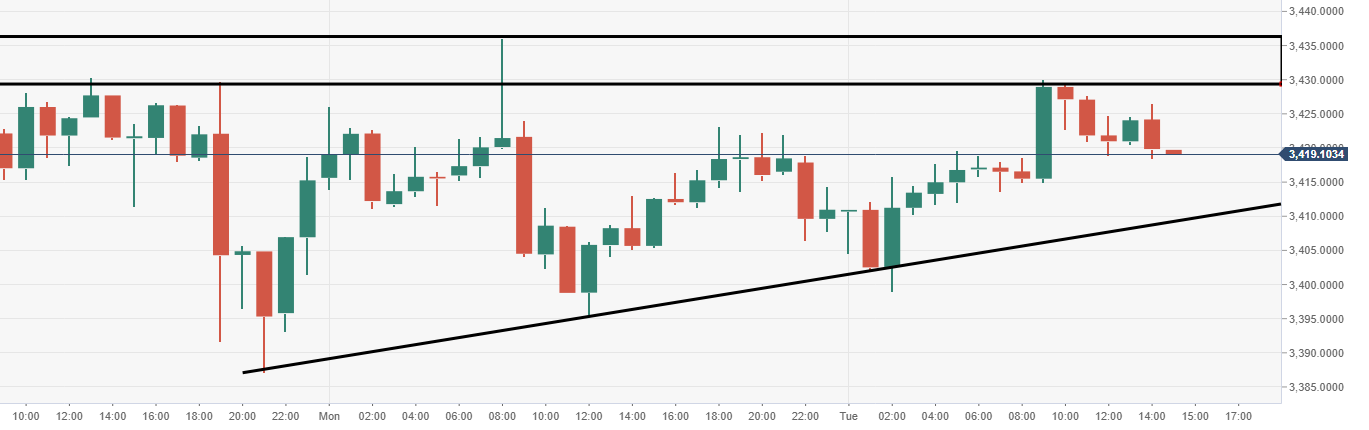
BTC/USD 15-minute chart
- Ascending trend line supporting near-term upside, however bull movement is capped by supply around $3450.
Spot rate: 3418.91
Relative change: +0.40%
High: 3429.97
Low: 3398.92
Trend: Bearish
Support 1: 3392.37, daily pivot point support.
Support 2: 3373.78, daily pivot point support.
Support 3: 3351.93, daily pivot point support.
Resistance 1: 3432.81, daily pivot point resistance.
Resistance 2: 3454.66, daily pivot point resistance.
Resistance 3: 3473.25, daily pivot point resistance.
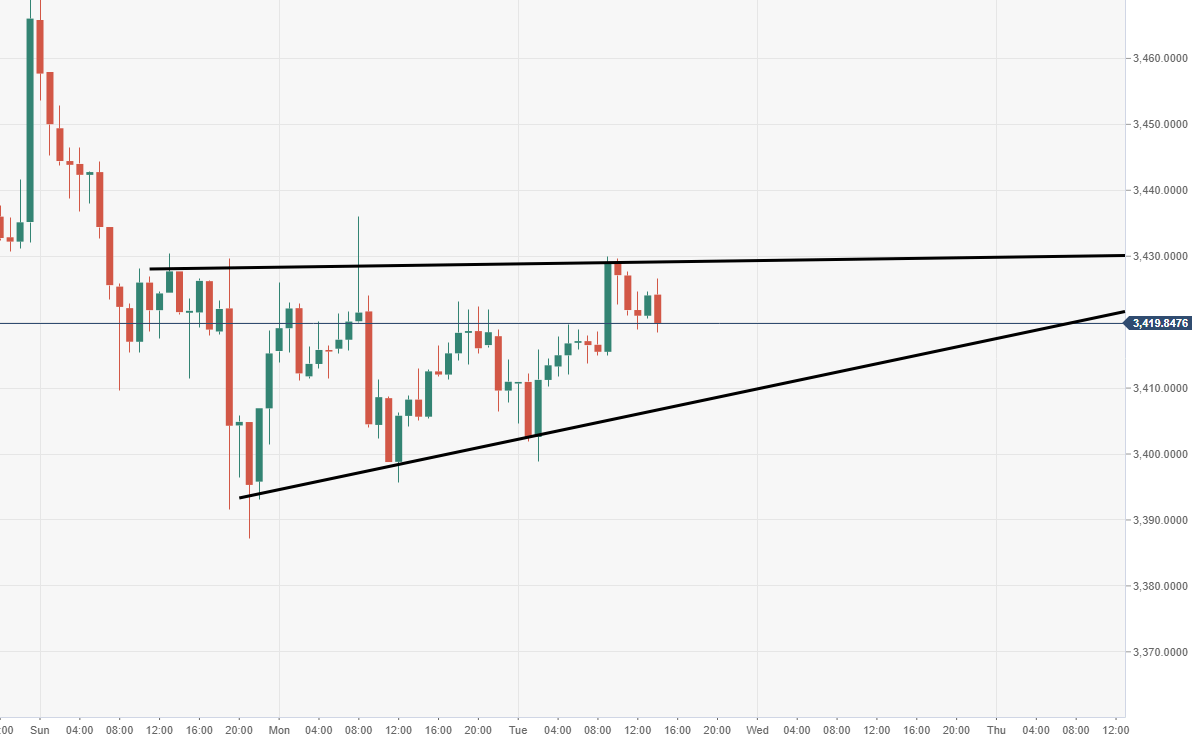
BTC/USD 60-minute chart
- Price action has formed somewhat of a pennant structure, near-term subject to a potential breakout south.
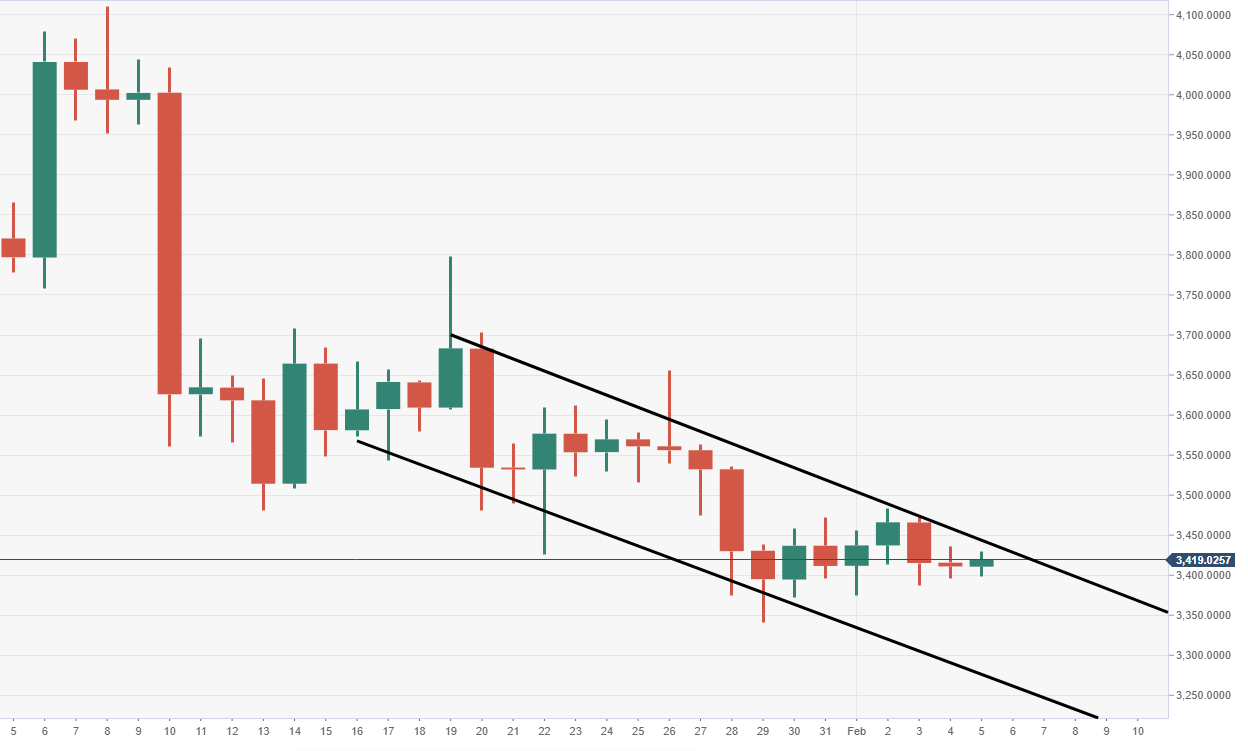
BTC/USD daily chart
- Price action moving within a descending channel formation, subject to a breakout north.