- Bitcoin price on Wednesday was seen nursing losses of around 2% in the second half of the session.
- BTC/USD bears are gunning for a retest to breakout from the current daily range-block formation.
BTC/USD 15-minute chart
- Bearish flag formation eyed via the 15-minute, subject to an extended breakout south.

Spot rate: 3360.51
Relative change: -2.05%
High: 3442.67
Low: 3355.09
Trend: Bearish
Support 1: 3409.03, daily pivot point support.
Support 2: 3388.45, daily pivot point support.
Support 3: 3377.98, daily pivot point support.
Resistance 1: 3440.08, daily pivot point resistance.
Resistance 2: 3450.55, daily pivot point resistance.
Resistance 3: 3471.13, daily pivot point resistance.
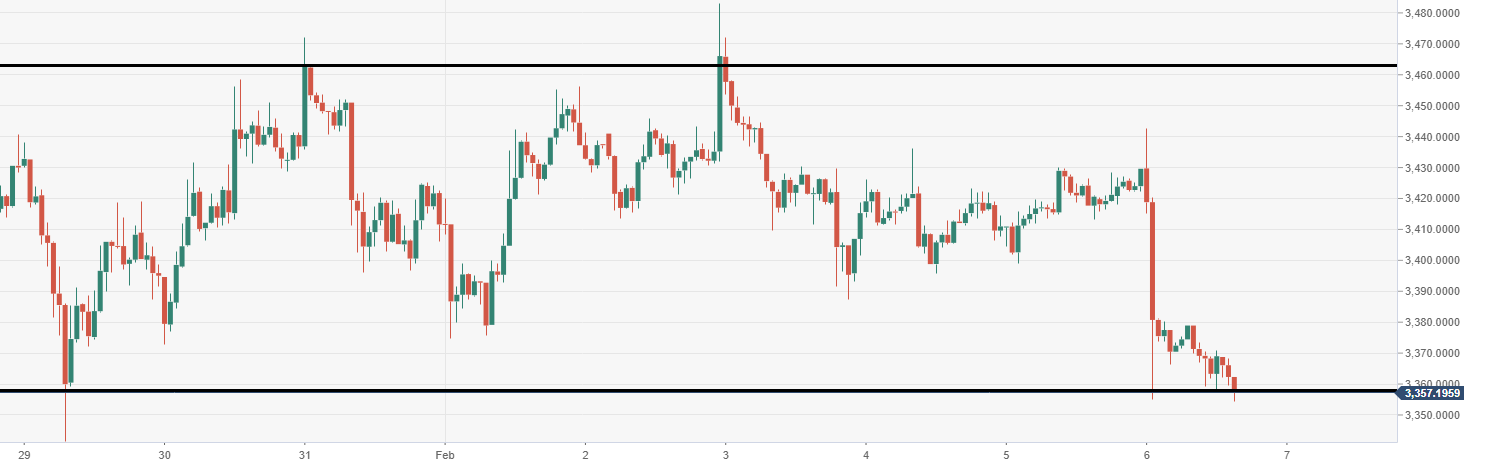
BTC/USD 60-minute chart
- As can see via the 60-minute a test of the key lower support is being observed.
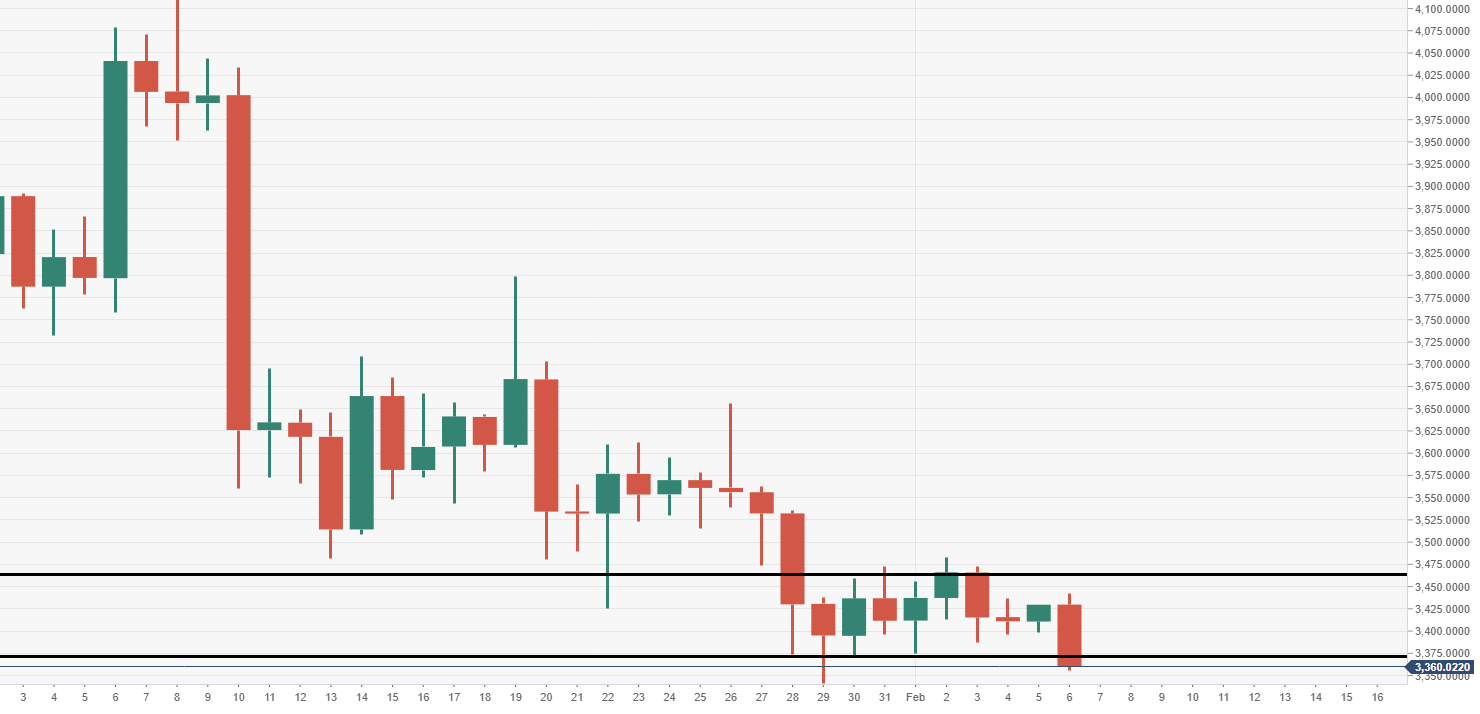
BTC/USD daily chart
- Bears are gunning for a breakout of the current daily range-block formation.