- Technical analysis shows that the LTC/USD market remains bullish despite a fightback from bears.
- The bears will look to break past support at $42.50 to reverse the momentum of the market.
LTC/USD bears managed to break past the support at $44, however, the overall sentiment remains bullish. The bulls need to protect the $42.50 support line to make sure that the upward momentum is sustained.
LTC/USD daily chart
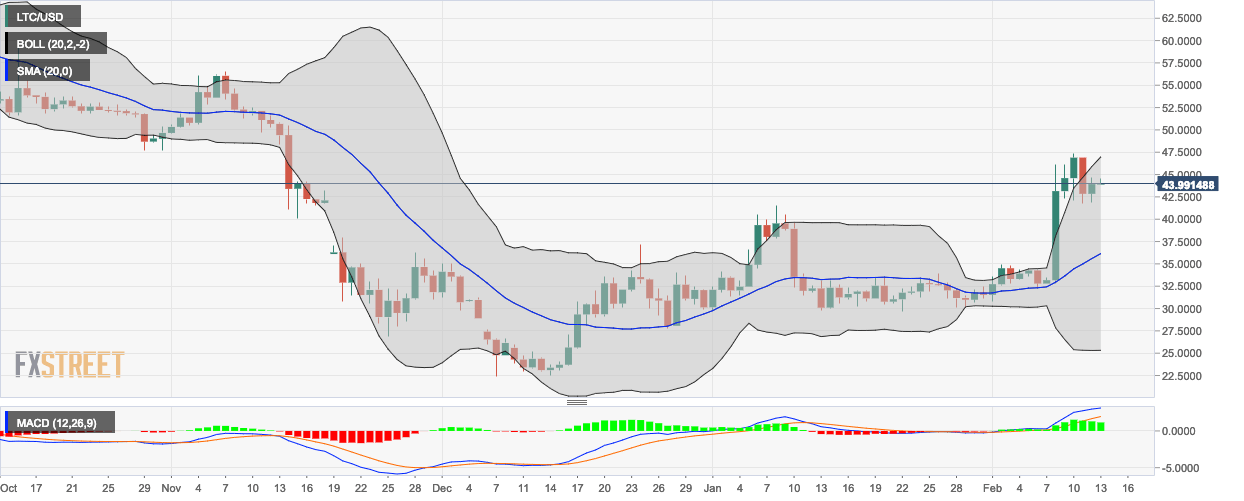
- LTC/USD is trending a little below the upper curve of the 20-day Bollinger band which still makes the overall market bullish.
- LTC/USD is still trending above the 20-day simple moving average (SMA 20) curve which shows a bullish sentiment.
- The moving average convergence/divergence (MACD) histogram also shows that the market remains bullish despite recent bearish actions.
LTC/USD 4-hour chart
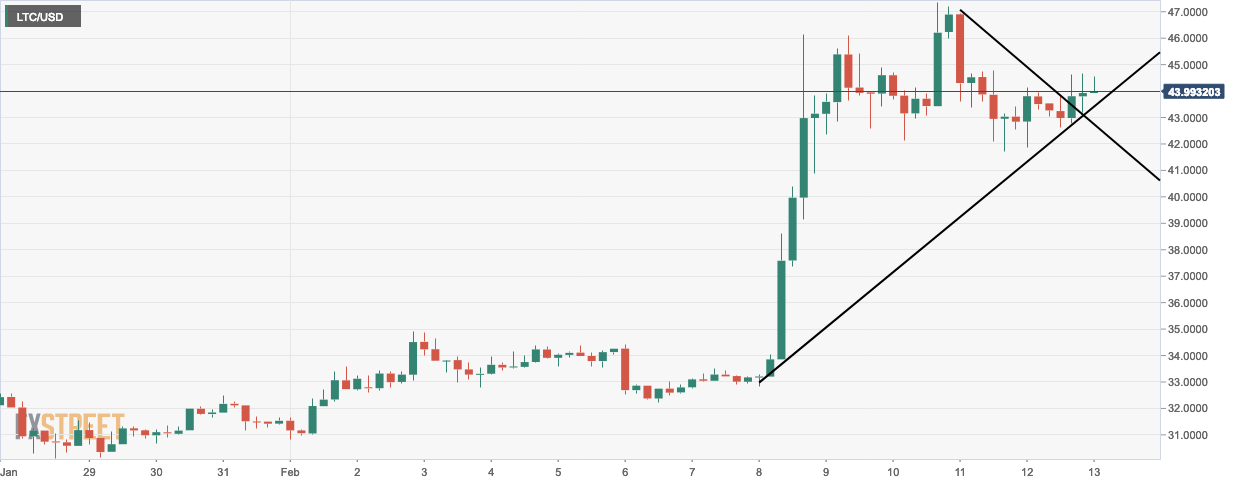
- The 4-hour market has had a bullish breakout from the triangle formation.
LTC/USD hourly chart
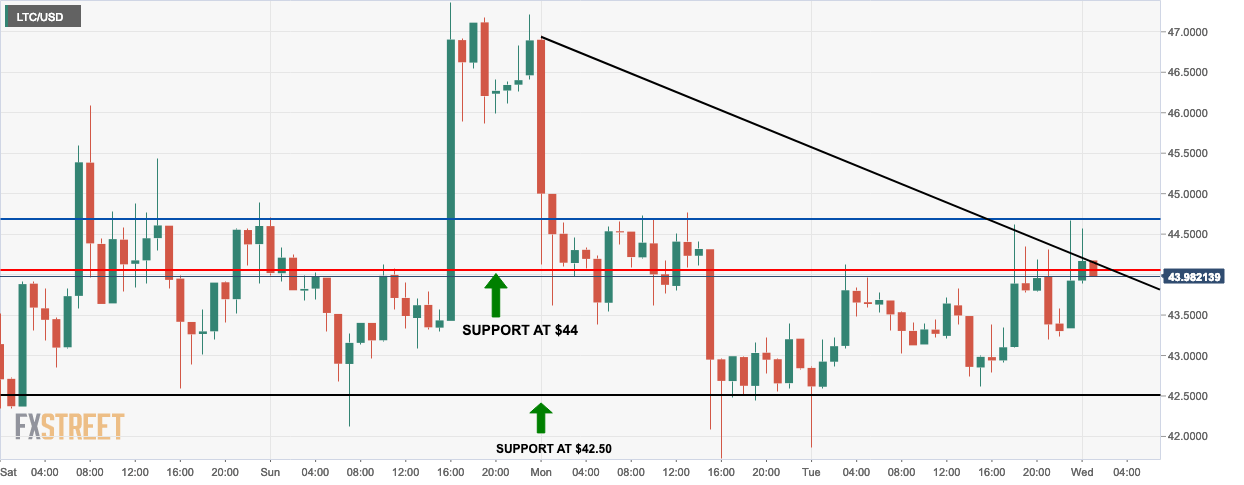
- The bears managed to bring the market below the $44 support in the last session.
- The bulls have to defend the $42.50 support line to prevent downward momentum.
Key Levels
- Resistance 3: $47.9131
- Resistance 2: $46.2902
- Resistance 1: $45.1078
- Pivot Point: $43.4849
- Support 1: $42.3026
- Support 2: $40.6797
- Support 3: $39.4974
