BCH/USD daily chart
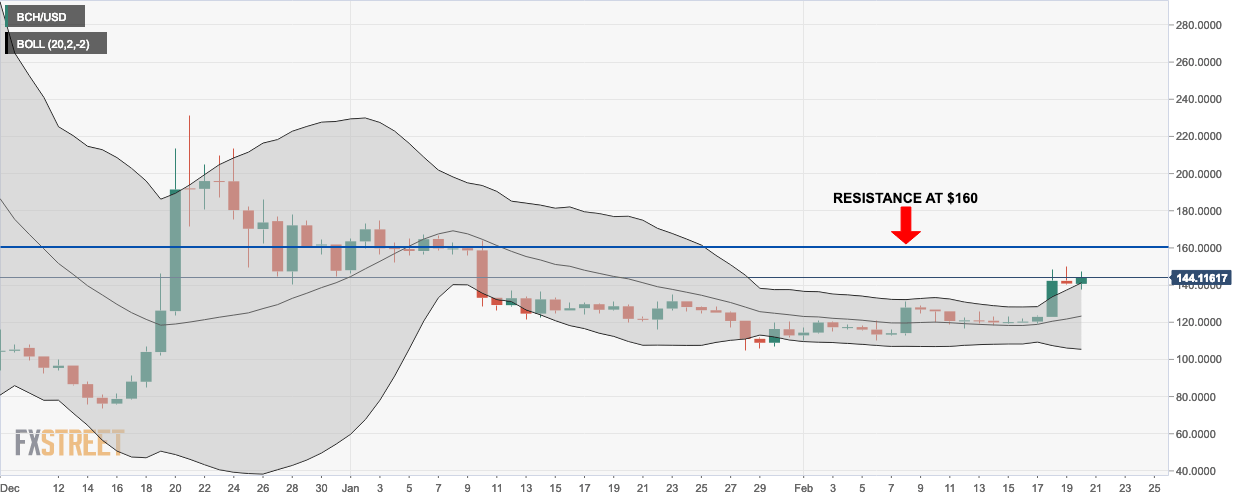
- BCH/USD is currently trading for $144 and is trending above the upper curve of the 20-day Bollinger Band, indicating a bullish market.
- Bulls need to gather more momentum and break past resistance at $160.
BCH/USD 4-hour chart
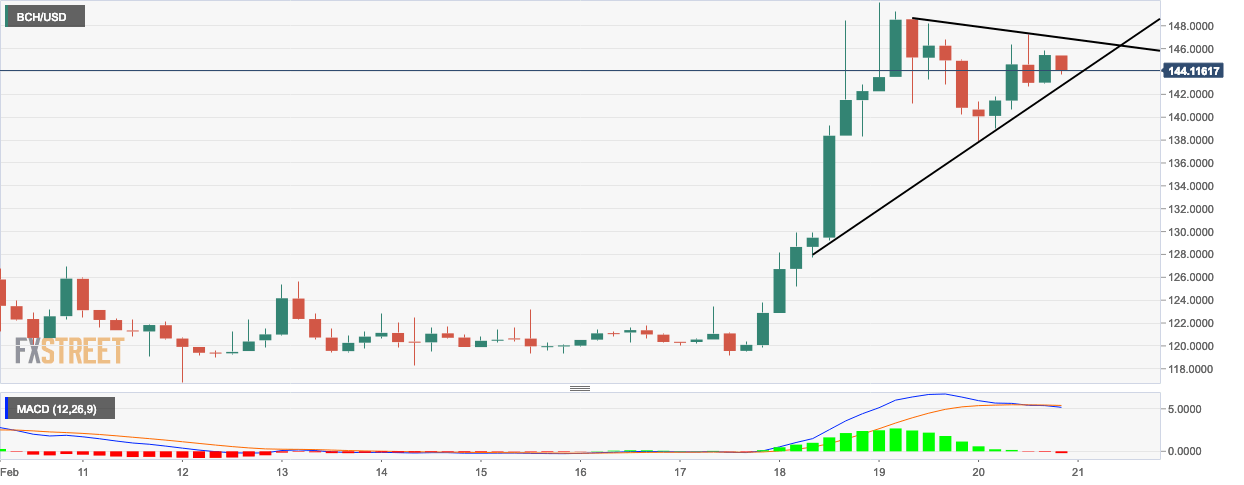
- The 4-hour BCH/USD market is prime for a breakout from the triangle formation.
- The moving average convergence/divergence (MACD) histogram shows that the bulls have lost momentum in the short-run.
- The market could be heading towards a period of consolidation.
BCH/USD hourly chart
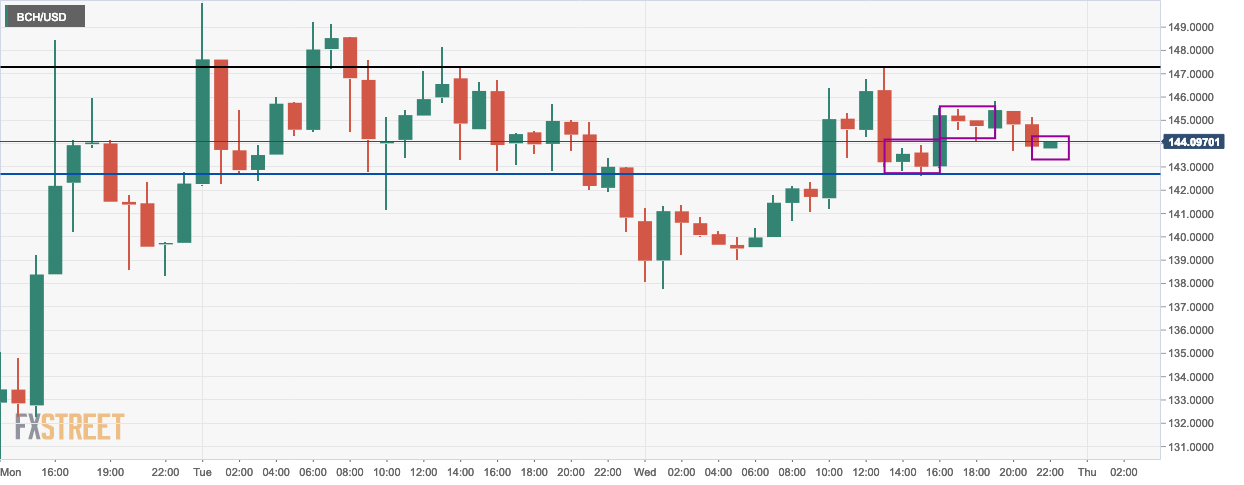
- BCH/USD hourly graph shows multiple flag formations.
- The latest session sees the formation of a bearish flag.
Key Levels
- Resistance 3: $157.0285
- Resistance 2: $153.5535
- Resistance 1: $147.1904
- Pivot Point: $143.7154
- Support 1: $137.3523
- Support 2: $133.8773
- Support 3: $127.5142
