- Bitcoin Cash on Thursday was seen nursing chunky losses of around 4.5%.
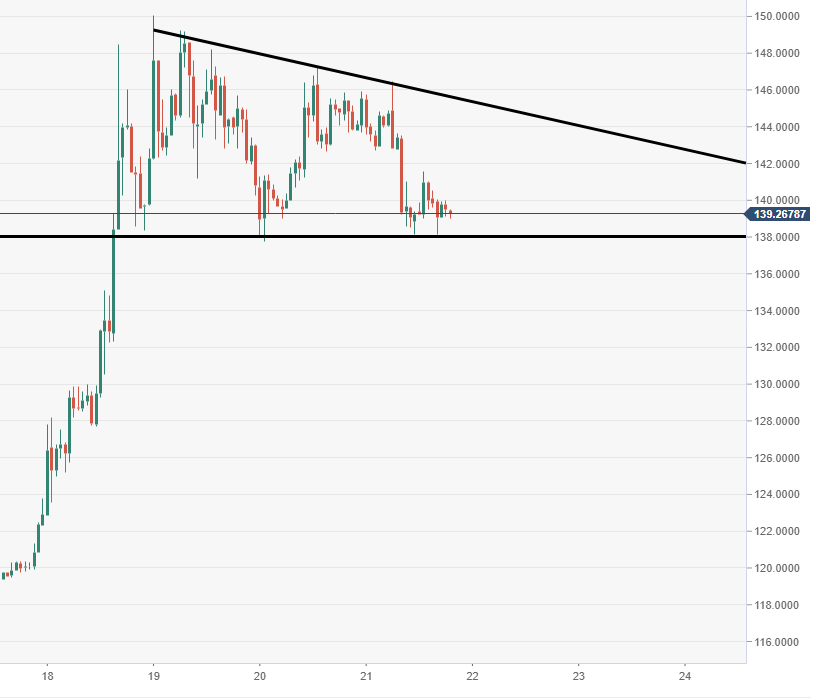
- BCH/USD price action remains moving within a bullish pennant structure seen via the 4-hour view.
BTC/USD 15-minute chart
- The significance near-term of that $138 support can be seen via the 15-minute chart view.
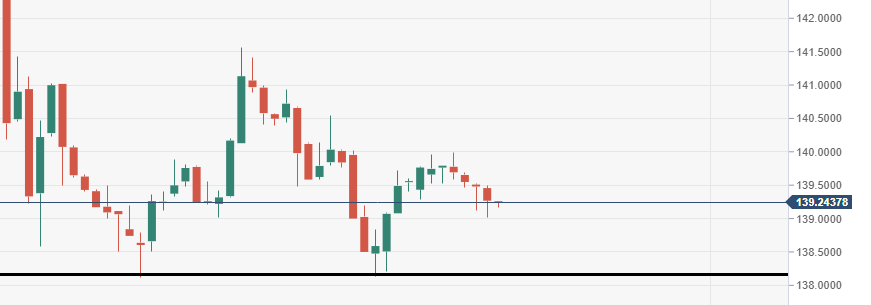
Spot rate:
Relative change: -%
High: 146.46
Low: 138.120
Trend: Bearish
BCH/USD 60-minute chart
- A bullish pennant pattern structure is eyed via the 4-hour chart view.
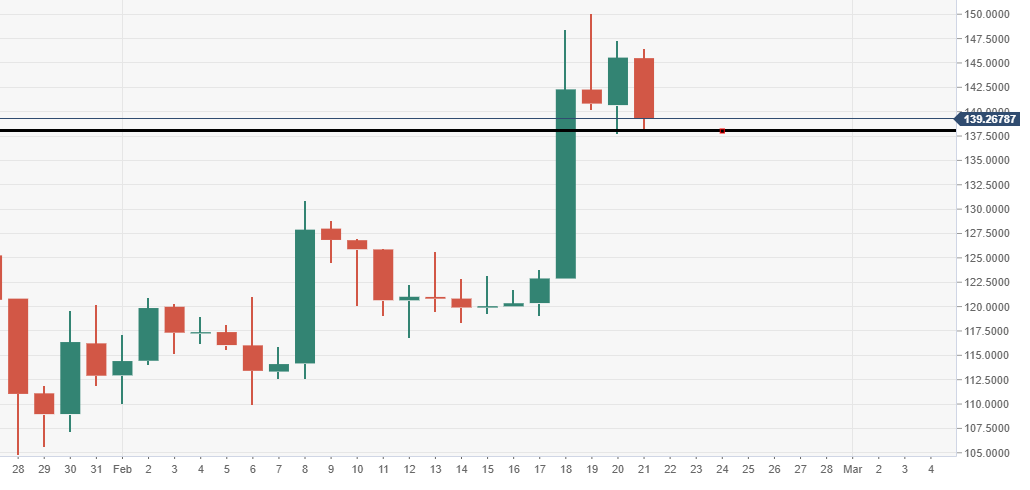
BCH/USD daily chart
- Price action is consolidating after the strong run of gains of late, key daily support eyed around $138 holding for now.