LTC/USD daily chart
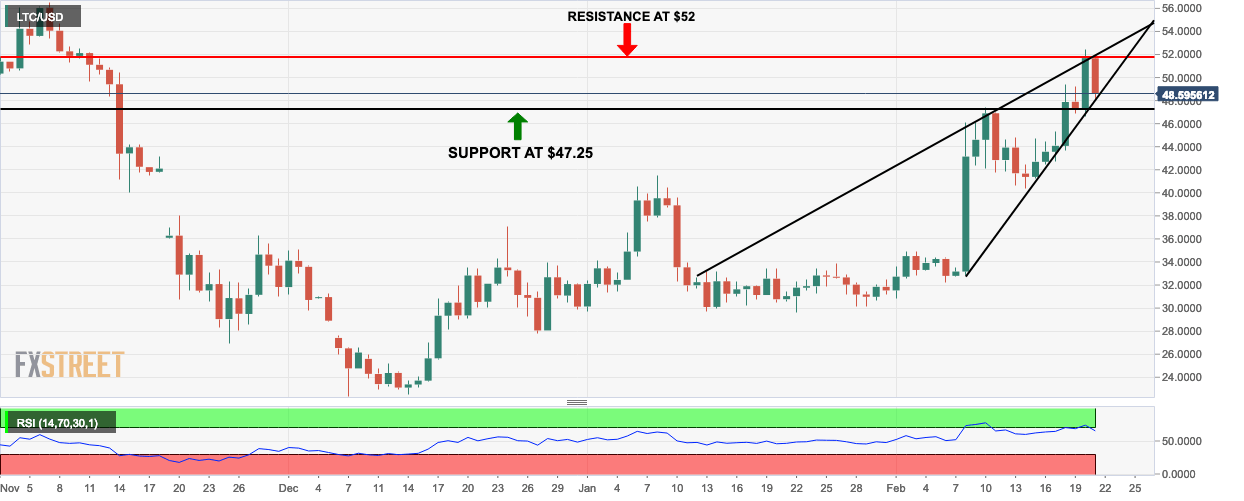
- Bears take over and pull the price down from $51.60 to $48.60
- Market charts an ascending wedge formation and is prime for a breakout.
- Relative strength index (RSI) creeps down from the overbought zone.
LTC/USD 4-hour chart
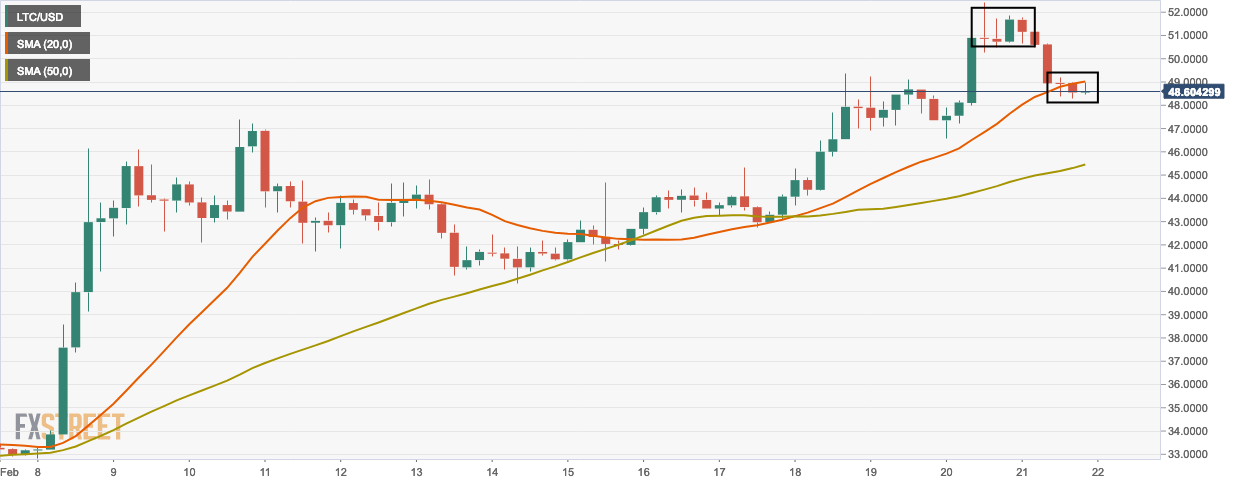
- LTC/USD 4-hour chart forms bearish flag and is ripe for a breakout.
- The 20-day simple moving average (SMA 20) curve has crossed over and is trending above the SMA 50 curve, which is a buy signal.
LTC/USD hourly chart
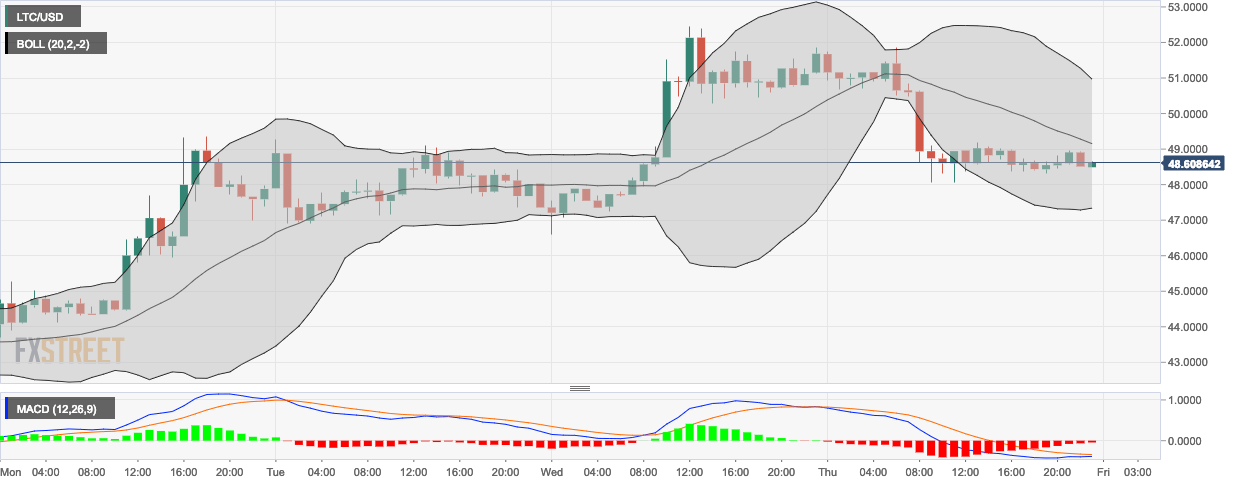
- LTC/USD hourly chart shows that the bulls are trying to fight back.
- The bearish momentum in the moving average convergence/divergence (MACD) is decreasing
- The market is now trending closer to the middle of the 20-day Bollinger band which shows that the momentum may be reversing in favor of the bulls.
Key Levels
- Resistance 3: $59.7367
- Resistance 2: $56.0878
- Resistance 1: $53.8857
- Pivot Point: $50.2368
- Support 1: $48.0347
- Support 2: $44.3859
- Support 3: $42.1838
