NEO/USD daily chart
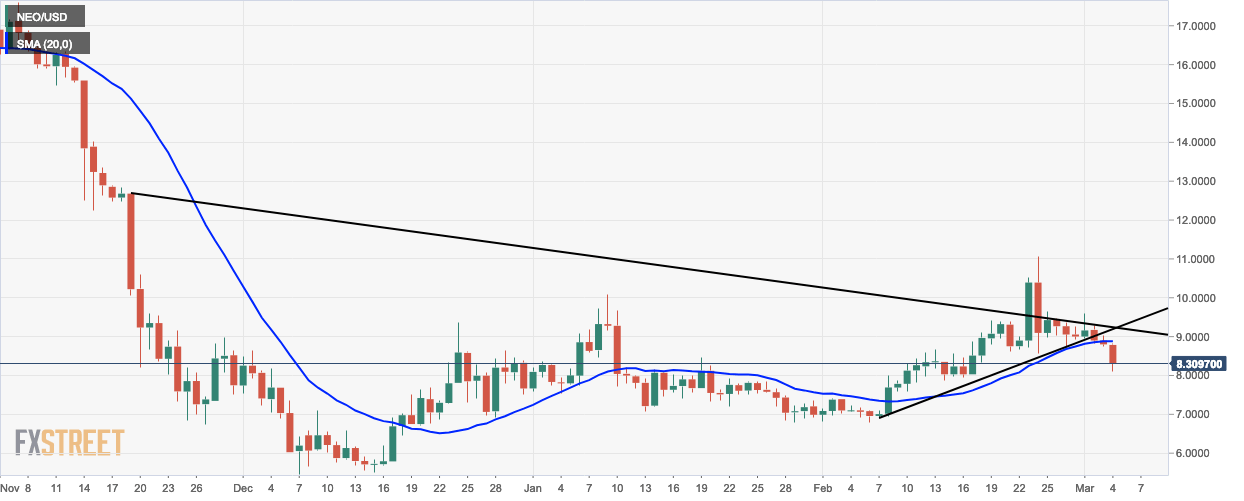
- NEO/USD daily price fell by 5.22% from $8.80 to $8.34 this Monday.
- The market has had a bearish breakout from triangle formation.
- Daily NEO/USD price has been trending below the 20-day simple moving average (SMA 20) curve for the last two sessions.
NEO/USD 4-hour chart
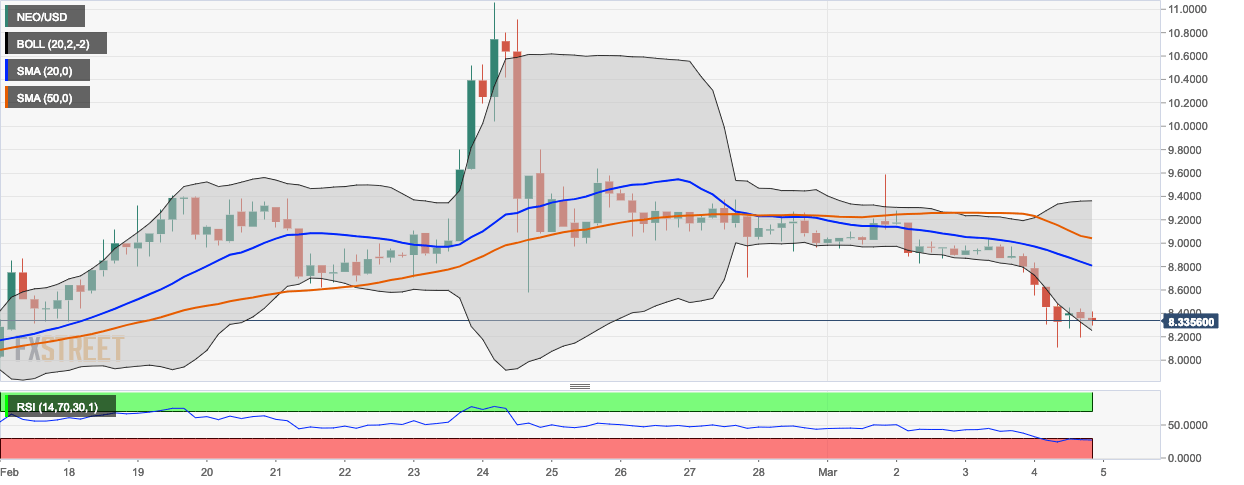
- In the 4-hour NEO/USD chart, the last three sessions have entered the lower-band of the 20-day Bollinger band which indicates that the bulls are trying to fight back.
- The SMA 50 curve has already crossed over the SMA 20 curve which indicates a sell sign.
- The relative strength index (RSI) has entered the oversold territory.
NEO/USD hourly chart
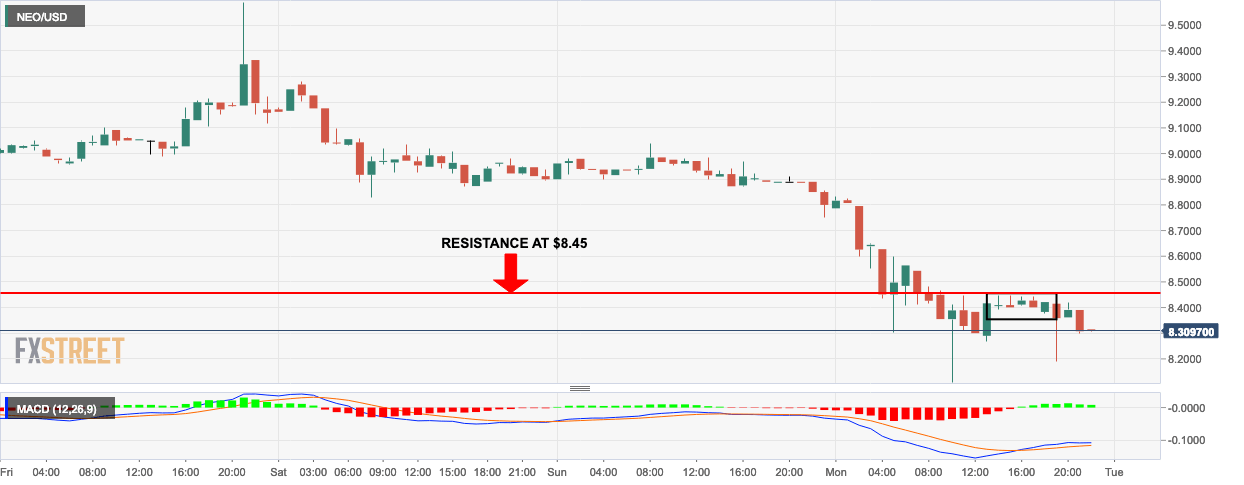
- The NEO/USD hourly chart has had a bearish breakout from a flag formation.
- The moving average convergence/divergence (MACD) histogram shows a decreasing bullish momentum as the market enters bearish territory.
- Bulls need to breach past $8.45 resistance level to reverse market momentum in the short-term.
