ETH/USD hourly chart
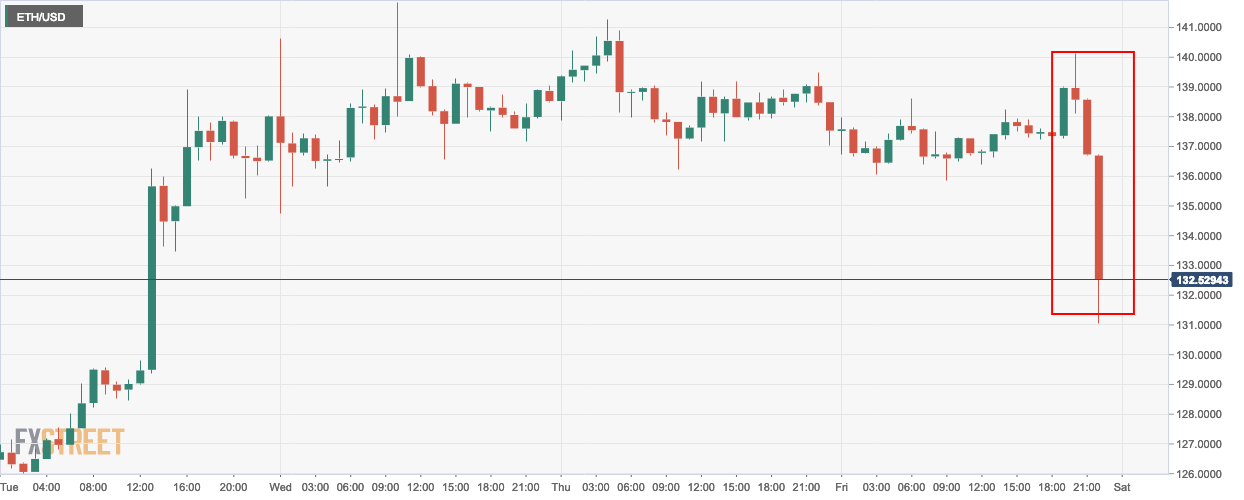
- ETH/USD went down from $139 to $132 as the market lost 5% of its value in just 3 hours.
ETH/USD daily chart
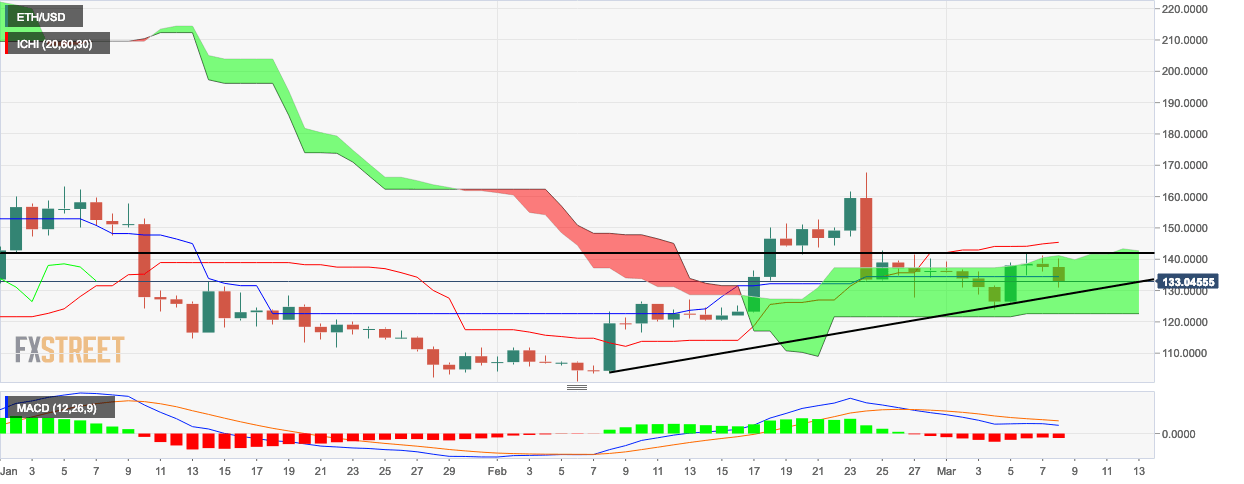
- The Ichimoku indicator shows that the daily ETH/USD market is trending within the green cloud. This indicates that a breakout is imminent.
- The moving average convergence/divergence shows that bearish momentum increased in the last session.
ETH/USD 4-hour chart
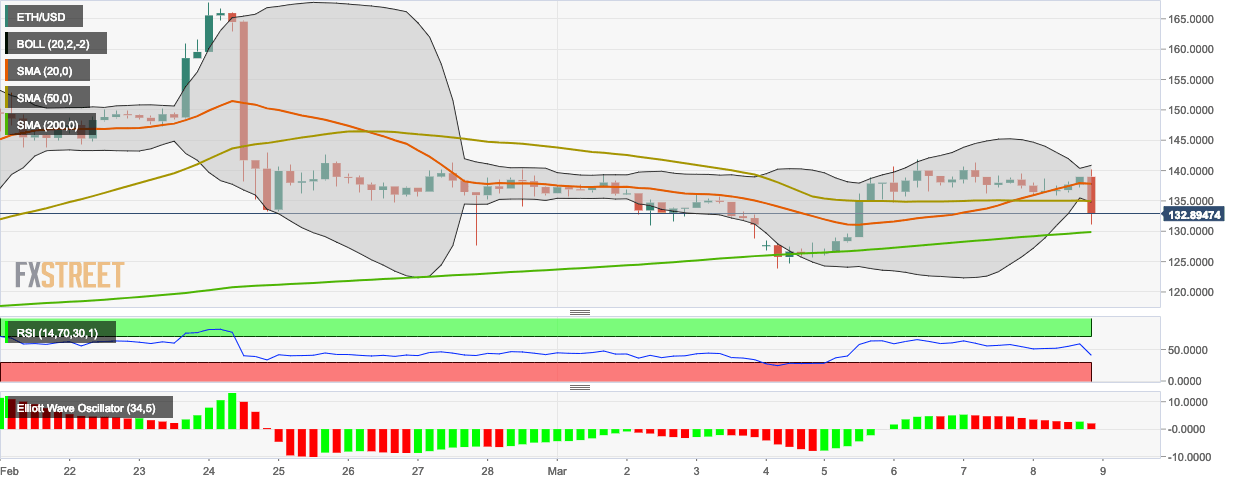
- The last session in the 4-hour ETH/USD chart pulled the price below both the 20-day simple moving average (SMA 20) and SMA 50.
- The market is still trending above the SMA 200 curve.
- The relative strength index (RSI) curve has taken a sharp downtrend towards the oversold territory.
- The last session was so strongly bearish it registered a bearish movement on the Elliot Wave (34,5) oscillator, even though 4 out of the previous 5 sessions were bullish.
Key Levels
- Resistance 3: $145.54
- Resistance 2: $143.41
- Resistance 1: $140.47
- Pivot Point: $138.34
- Support 1: $135.40
- Support 2: $133.27
- Support 3: $130.34
