BTC/USD daily chart
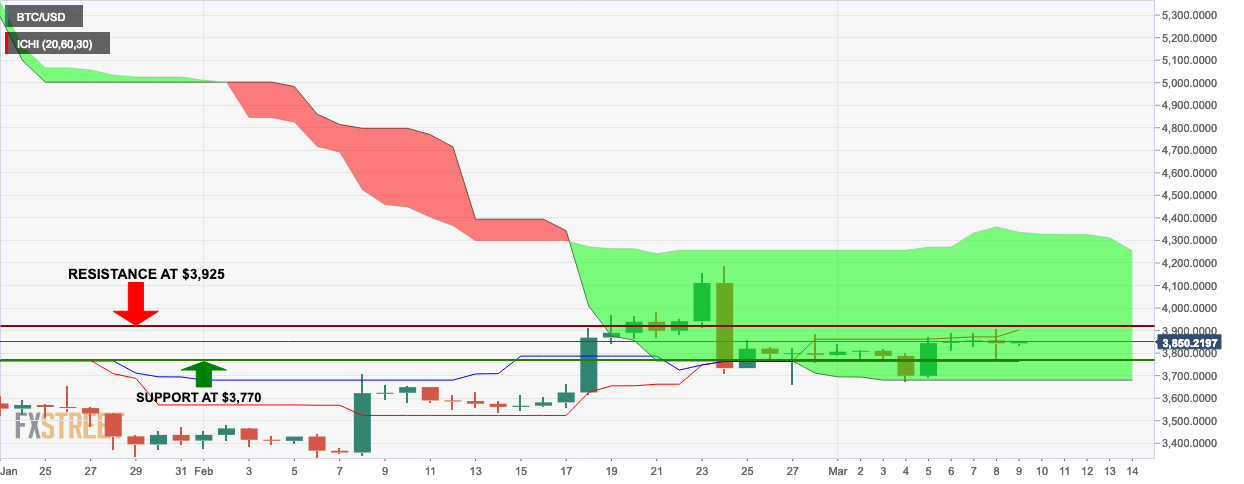
- Bulls opened up the Saturday market by crawling Bitcoin’s price up to $3,850.
- The price is trending inside the green Ichimoku cloud which shows that the price is consolidating before a breakout.
- The green cloud is exceptionally thick, which shows that it is an active area of support.
BTC/USD 4-hour chart
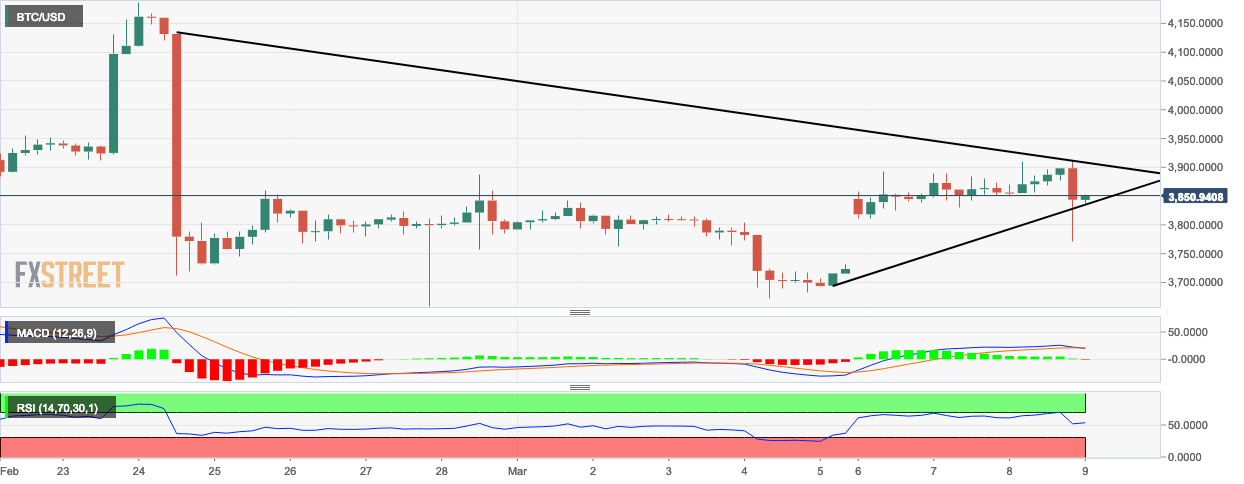
- The relative strength index (RSI) was trending in the overbought zone and is now going towards the neutral area.
- The moving average convergence/divergence (MACD) shows that momentum has reversed from bullish to bearish.
BTC/USD hourly chart
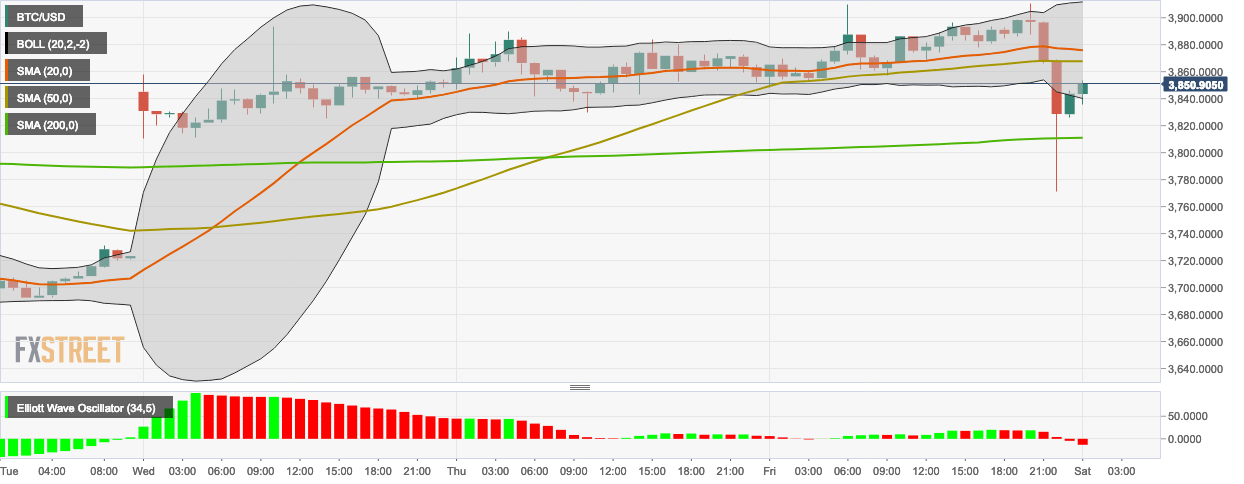
- The last session of the BTC/USD hourly chart crept above the lower curve of the 20-day Bollinger curve which is a bullish sign.
- The market is trending below both the 20-day simple moving average (SMA 20) and SMA 50.
- The market is still trending above the SMA 200 curve.
- The Elliot Wave oscillator’s last four sessions were red which is a significant bearish sign.
Key Levels
- Resistance 3: $4,051.95
- Resistance 2: $3,981.17
- Resistance 1: $3,912.43
- Pivot Point: $3,841.65
- Support 1: $3,772.90
- Support 2: $3,702.12
- Support 3: $3,633.38
