- Ripple’s XRP price on Wednesday holding gains of some 0.8% in the second half of the session.
- XRP/USD bulls are testing the upper trend line of a triangular structure containing upside.
- Price action via the 60-minute chart view makes a push above the near-term descending trend line.
Spot rate: 0.3191
Relative change: +0.81%
High: 0.3231
Low: 0.3127
XRP/USD 60-minute chart
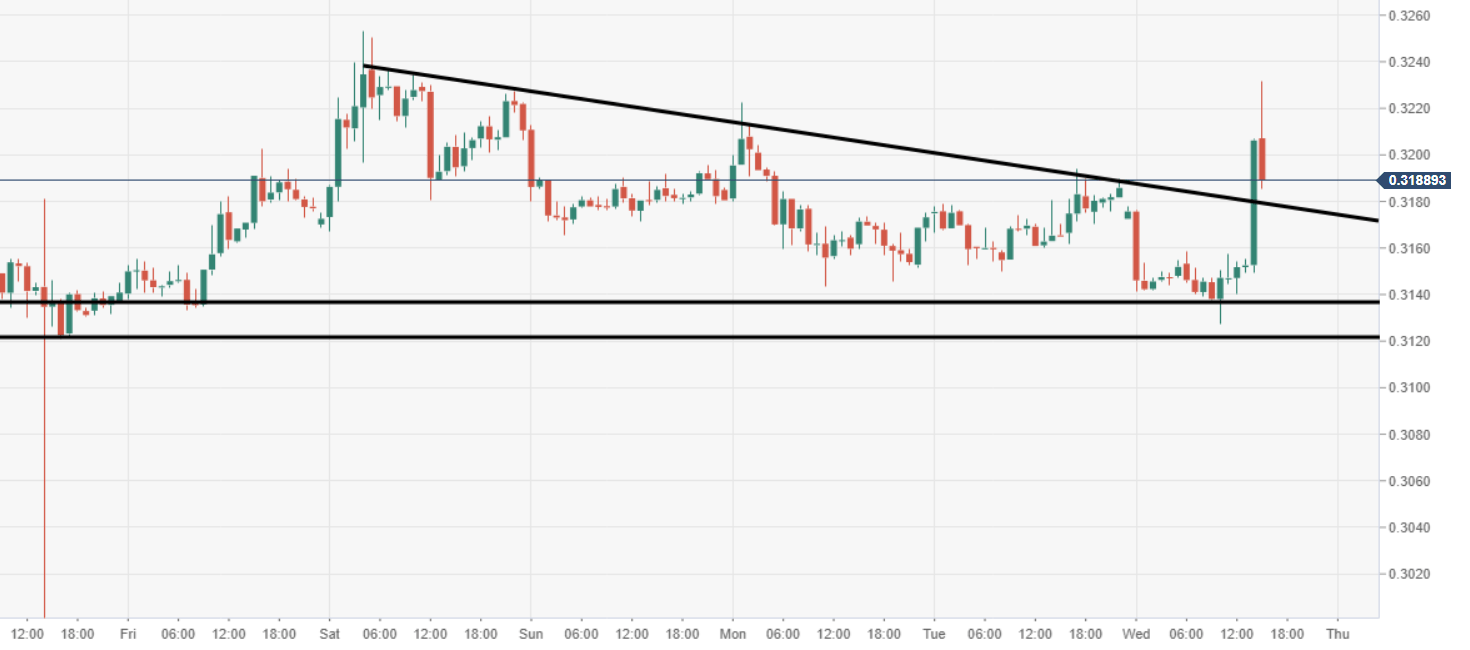
- Price breaks above a near-term descending trend line, seeing a surge higher.
XRP/USD daily chart
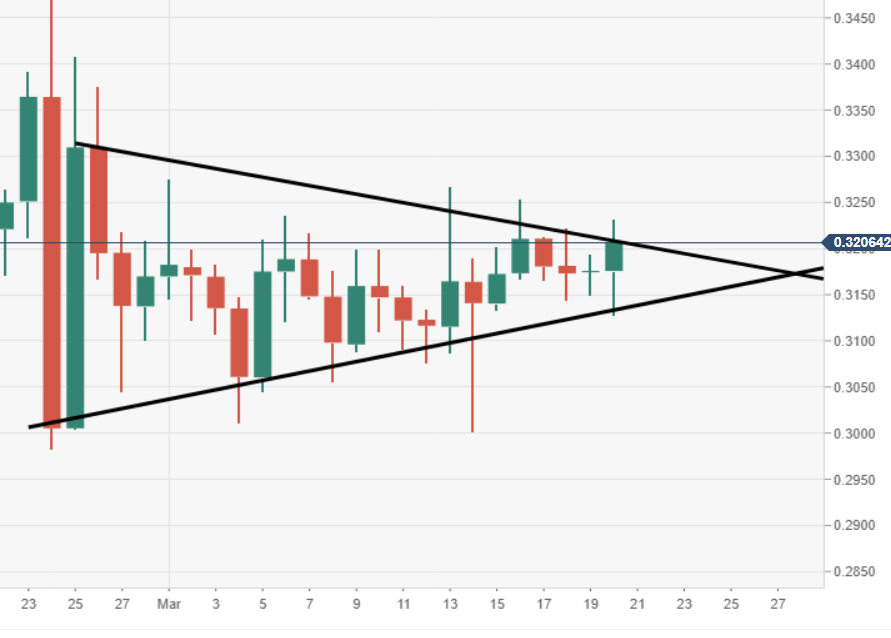
- The breakout is getting closer, as price tests the upper part of the triangular structure.
- Key upside resistance tracking from $0.3200-50 price range, a break above could see a fresh wave of buying pressure.
