BTG/USD daily chart
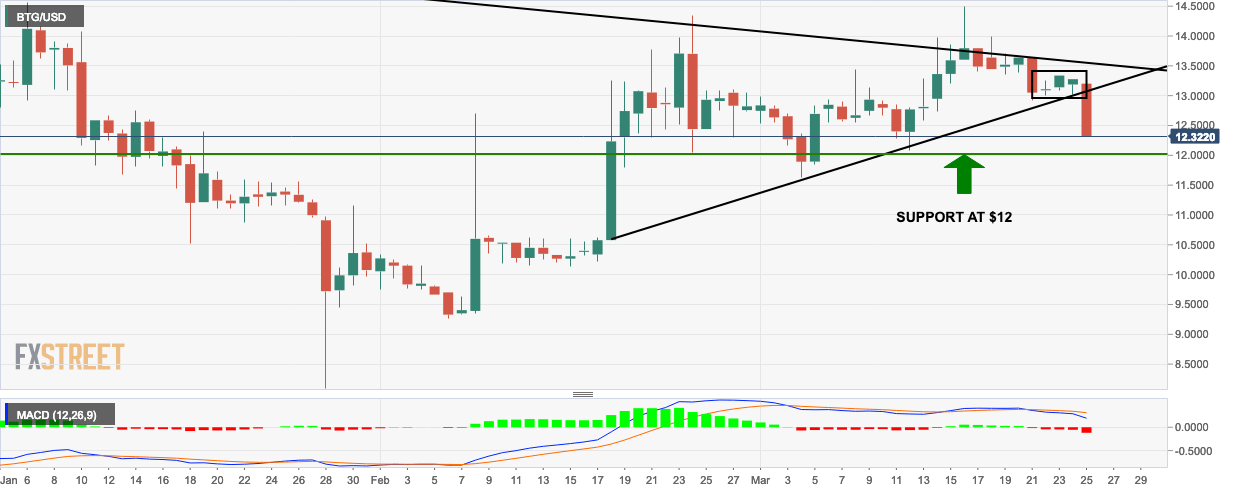
- BTG/USD fell by 7% as the price went down from $13.20 to $12.30 this Monday.
- The market had a bearish breakdown from a flag formation.
- The momentum of the bearish momentum was so strong that the price plummetted below the long-standing support provided by the upwards trending line.
- The moving average convergence divergence (MACD) indicator shows that the MACD curve is diverging away from the signal line which indicates further bearish momentum.
BTG/USD 4-hour chart
-636891470242173340.png)
- The 4-hour BTG/USD market has had a bearish breakout from the red cloud of the Ichimoku indicator.
- The green cloud indicates that bulls may be getting into the market in the future.
- The relative strength index (RSI) curve has entered the oversold territory.
BTG/USD hourly chart
-636891470469991617.png)
- The last two sessions in the BTG/USD hourly chart sneaked the market back into the 20-day Bollinger band.
- The Bollinger band also indicates an extremely volatile market.
- The last 15 sessions of the Elliot Wave oscillator shows bearish tendencies with increasing intensity.
Key Levels
- Open: $13.20
- High: $13.20
- Low: $12.31
