- Ethereum price on Friday is trading in minor negative territory, down some -0.9% in the second half of the session.
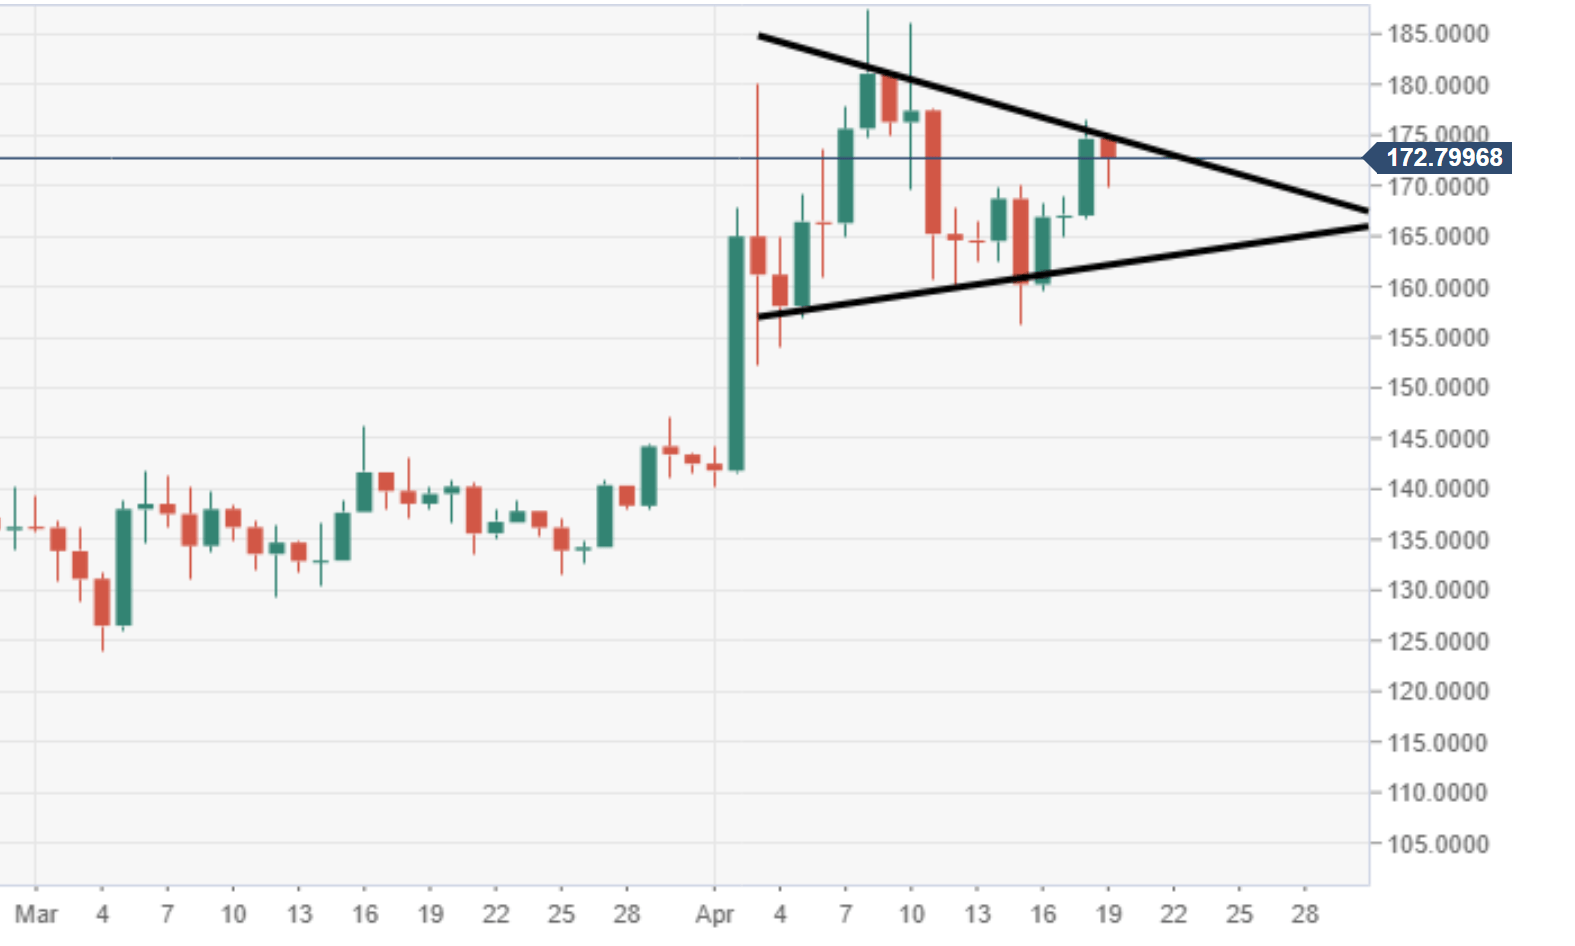
- ETH/USD price action is narrowing within a triangular structure formation, subject to a breakout.
- The bulls are attempting to reclaim the $200 price territory, last traded here back in November 2018.
Spot rate: 172.81
Relative change: -0.90%
High: 174.67
Low: 169.85
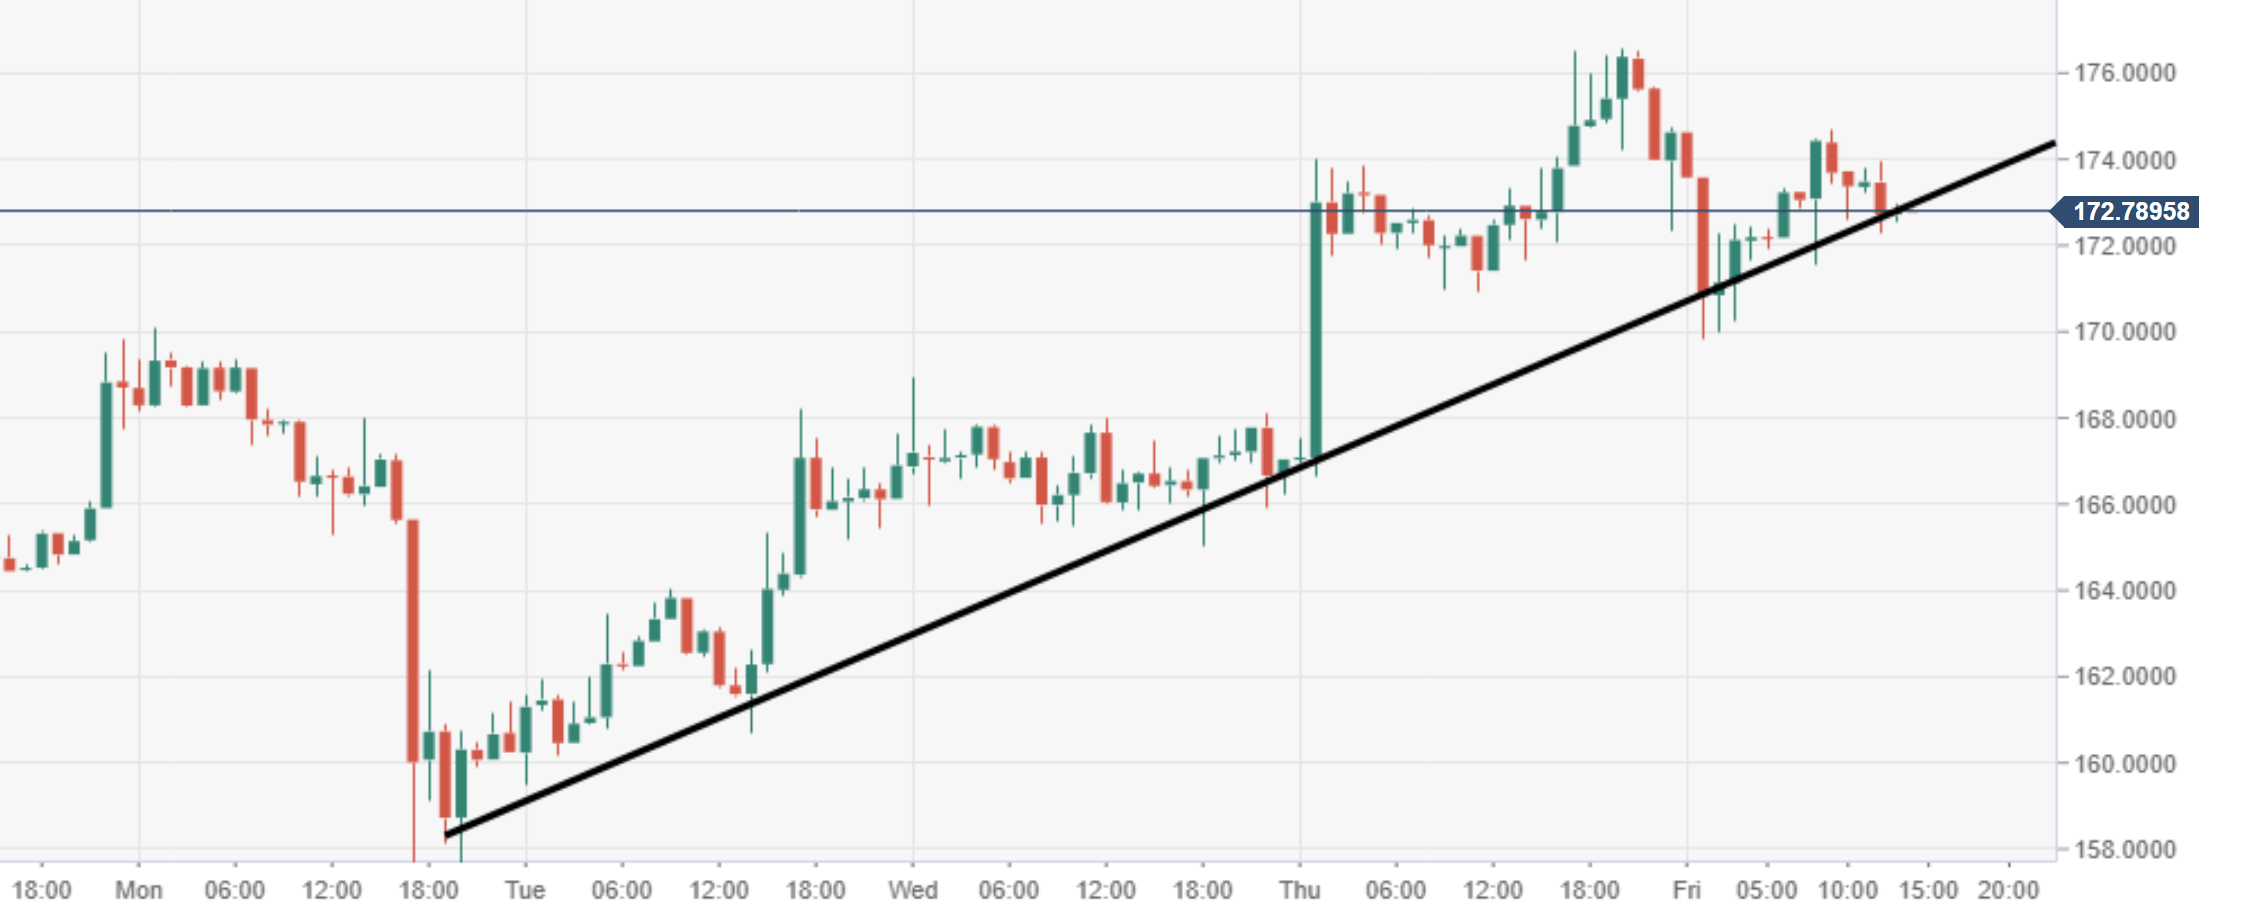
ETH/USD 60-minute chart
- Price action via the 60-minute chart view is supported to the upside by an ascending trend line.
ETH/USD daily chart
- The price is narrowing within a triangular structure, also viewed as a pennant formation, subject to a breakout.