- NEO/USD went down from $11.35 to $11.10 this Friday.
- SMA 200 and SMA 50 about to converge and chart the golden cross pattern.
NEO/USD went down from $11.35 to $11.10 this Friday, however, technical analysis shows us that the bulls are quietly taking back the control. Ever since the bulls failed at the $14 resistance line, the bears have had a stranglehold on the market, taking the price down from $13.75 to $11.10 over the last two weeks. On the upside, if the bulls do a takeover, the near-term resistance lies at $11.50. However, if the bears continue their downward momentum, the nearest support is at $10.75.
NEO/USD Daily Chart
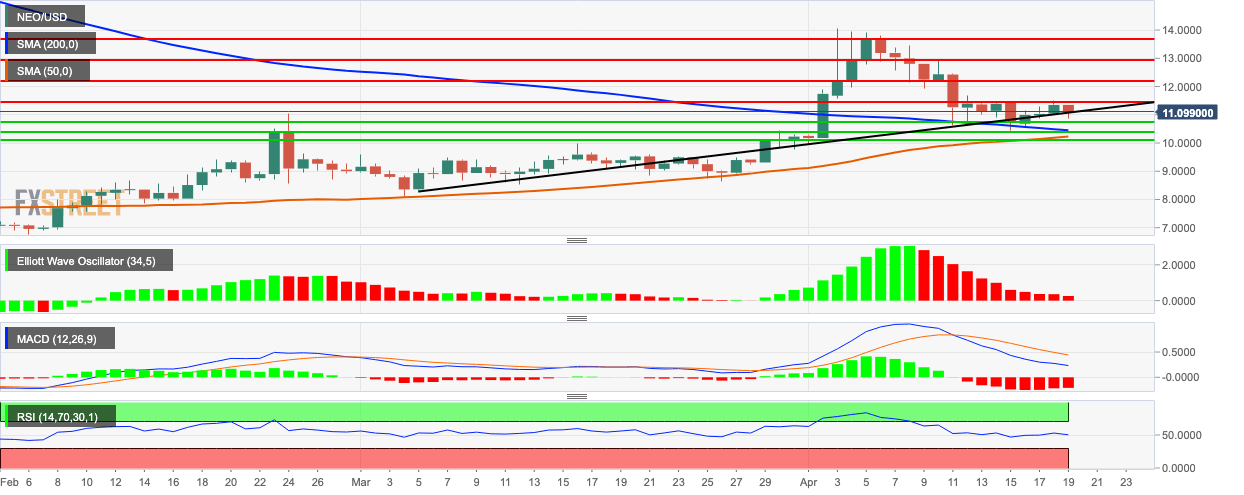
- NEO/USD is still trending above both the SMA 200 and SMA 50 curves.
- SMA 200 and SMA 50 is about to chart a golden cross pattern which is a heavily bullish signal.
- The Elliot Wave Oscillator has been bearish over the last 11 sessions but with decreasing intensity.
- The signal line and MACD line has minimized its divergence, which shows decreasing bearish momentum.
- The relative strength index (RSI) indicator is trending in the neutral zone.
