- XRP/USD trading pair upside has been limited under $0.3200.
- The intended breakout will place XRP in an upward trajectory heading towards $0.3400.
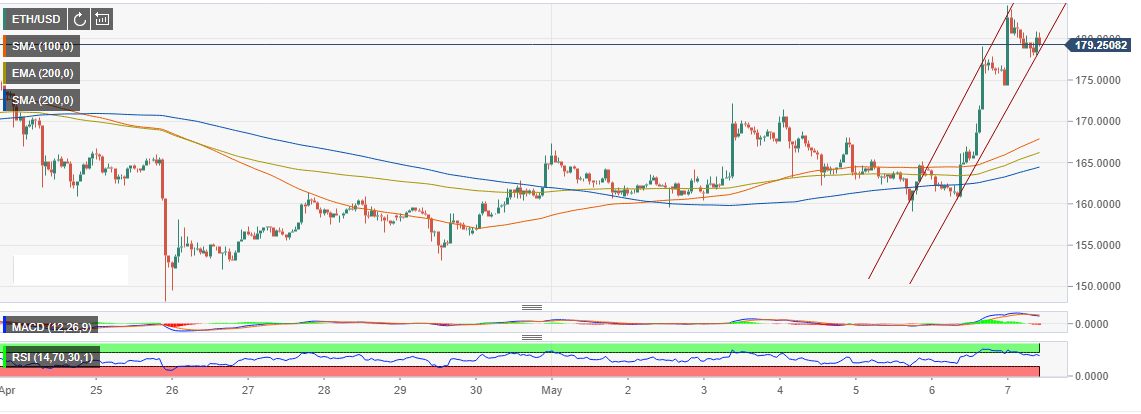
Ripple is the only digital asset is among the top three. Bitcoin led the recovery on the market today with gains in the excess of 4% to extent of hitting highs above $5,900. Ethereum, on the other hand, is still in a bullish trend around $180 following a 2.67% rise on the day.
It is clear that Ripple is among the assets that have been left behind by the steaming Bitcoin bandwagon. In April the crypto surged to highs around $0.38 but failed to sustain gains beyond this level. In turn, there was a correction to the south that has led to Ripple testing the areas close to $0.2800 primary support.
While we have seen a recovery above $0.300, XRP/USD trading pair upside has been limited under $0.3200. At the moment, XRP is trading at $0.3055 with its upside immediately capped by a confluence made by the 50 Simple Moving Average (SMA) and the 100 SMA 4-hour. All indicators show that Ripple is inclined towards the south, starting with the Relative Strength Index (RSI) which has been rejected from the overbought and is heading downwards at 69.047.
However, a short-term bullish flag pattern indicates that a breakout is coming in the near future. For this breakout to occur we must see XRP/USD trading above $0.3200 hurdle and pushing towards $0.3300. The intended breakout will place XRP in an upward trajectory heading towards $0.3400 as well as $0.3600 supply zones.
XRP/USD 4-hour chart

