- BCH/USD went down from $390.50 to $384 this Wednesday.
- Price may be consolidating before bulls test $400 level.
BCH/USD went down from $390.50 to $384 in the early hours of Wednesday. Bitcoin Cash looks like it is in a consolidation phase. If the bulls can gain enough momentum following the consolidation, the price will surpass $400. If that does happen, then it will be the first time since November 2018 when BCH/USD was able to do so.
BCH/USD Daily Chart
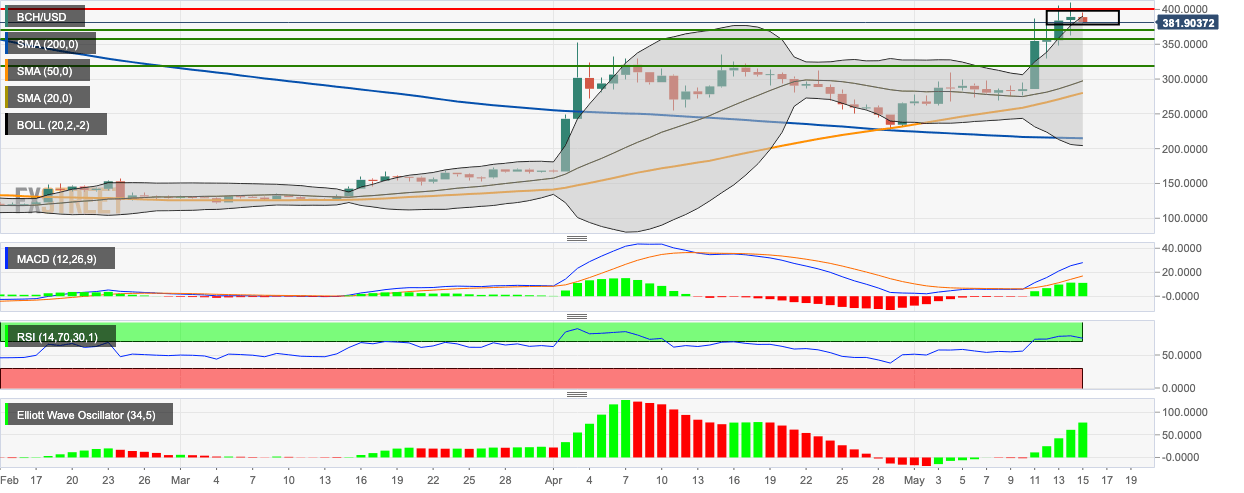
- BCH/USD is consolidating in a flag formation.
- The 20-day Bollinger band’s widening jaw shows increasing market volatility.
- The latest bearish session brought the price back inside the Bollinger band.
- The price is trending above the SMA 200, SMA 50, and SMA 20 curves.
- The signal line has diverged away from the MACD line showing bullish momentum.
- The Elliot Wave Oscillator shows five consecutive bullish sessions.
- The relative strength index (RSI) indicator is still lurking inside the overbought zone though it looks like it will be creeping out soon.
