BCH/USD Daily Chart
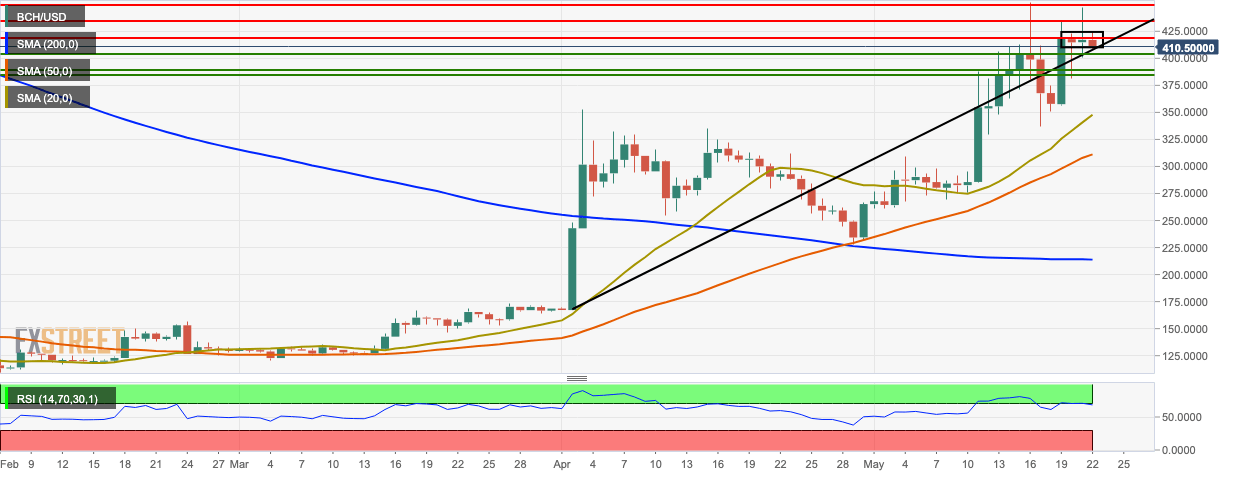
- BCH/USD went down from $416.25 to $411 this Wednesday.
- The price is currently consolidating in a flag formation.
- On the downside, the nearest support level lies at $405.
- The market is trending above the SMA 200, SMA 50, and SMA 20 curves.
- The price is creeping on the edge of the overbought zone.
BCH/USD 4-Hour Chart
-636940959772981554.png)
- The extreme squeeze of the 20-day Bollinger band shows decreasing market volatility.
- The last session of the 4-hour market has dropped into the lower half of the 20-day Bollinger band.
- The moving average convergence/divergence (MACD) indicator shows that market momentum has now become bearish.
BCH/USD Hourly Chart
-636940959178592689.png)
- The Elliot wave oscillator shows seven consecutive bearish sessions.
- The hourly price is currently trending in a downward channel formation.
- The Ichimoku indicator shows that current and future market sentiment is bearish.
Key Levels
