- Bitcoin hits the pause button at $9,400 to create fresh demand.
- The building bullish momentum is supported by the Relative Strength Index (RSI).
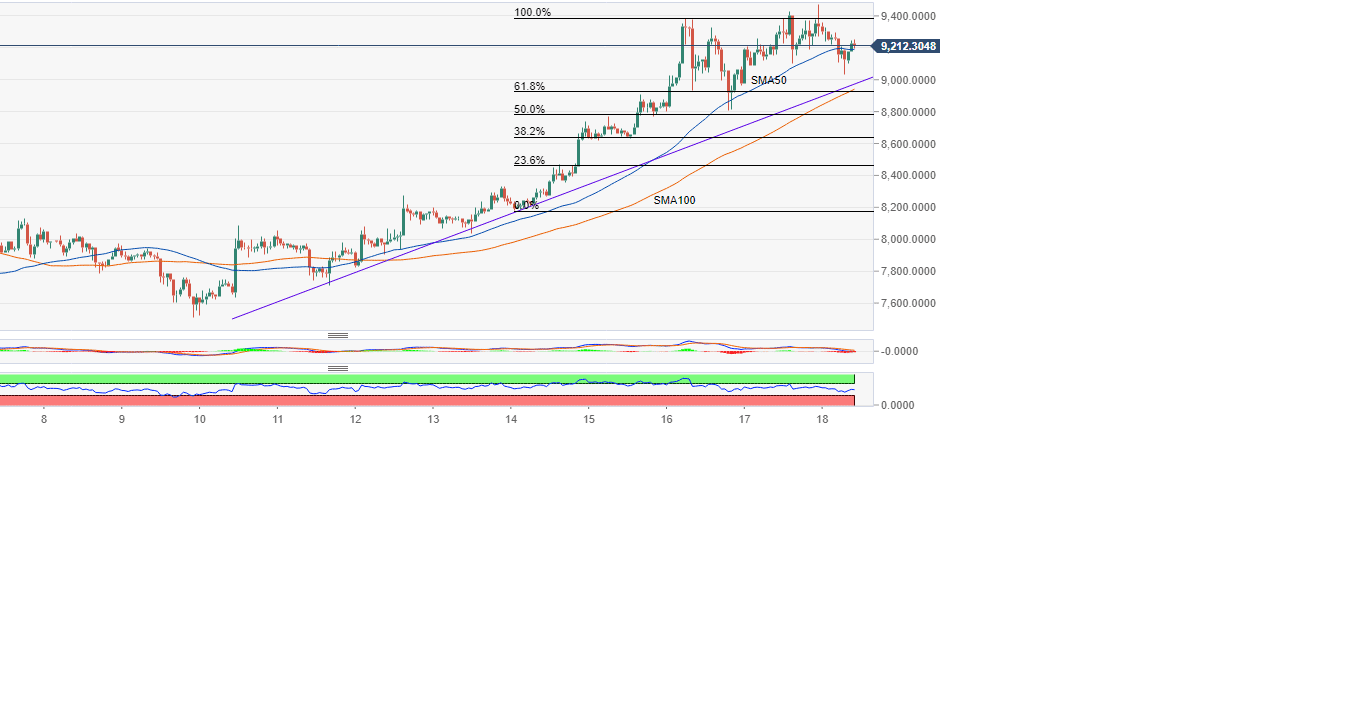
Bitcoin surged incredibly in the last two days breaking above $9,000 for the second time this year. The initial break failed to make any significant headway forming a high at $9,090. This opened the Pandora box as the price plunged under $8,000 to a low close to $7,500.
Looking at the 1-h chart for BTC/USD trading pair, Bitcoin sideways action lasted for more than seven days following the drop. The $600 narrow range between $7,500 and $8,100 led to indecision where Bitcoin remained in a motionless state until June 12 when it began trending upwards again.
The break above the moving average resistance (both the 50 Simple Moving Average (SMA) and the 100 SMA 1-h) encouraged confidence in the uptrend as Bitcoin jumped above $8,000 level. The prediction by a Fundstrat analyst that Bitcoin rise above $8,400 will propel it back in the $9,000 held water as the price zoomed into these levels over the weekend.
Although the investors are waiting for Bitcoin to fulfill the prediction by rising to levels around $9,800 – $10,000, BTC/USD has hit new 2019 highs above $9,400 but corrected to the current $9,243.
The building bullish momentum is supported by the Relative Strength Index (RSI) slopping upwards at 54. The indicator has been forming a lower low pattern suggesting rising bearish pressure. However, the changing direction upwards suggests that the bulls have no intentions of losing control. Initial support is offered by the 50 SMA ($9,198.8). Next target support is $9,000 while $8,800 will once again come to rescue of the bulls in case of a reversal.
BTC/USD 1-h chart