- The price has gone up from $9,535 to $10,225 this Friday.
- Technical analysis shows that bearish correction may be around the corner.
BTC/USD price has gone up from $9,535 to $10,225 this Friday. In the early hours of Saturday, the price has gone up further to $10,230. Towards the end of Friday, BTC/USD shot up from $9,915 to $10,225 within one hour. Technical analysis shows that bearish correction may be around the corner.
BTC/USD daily chart
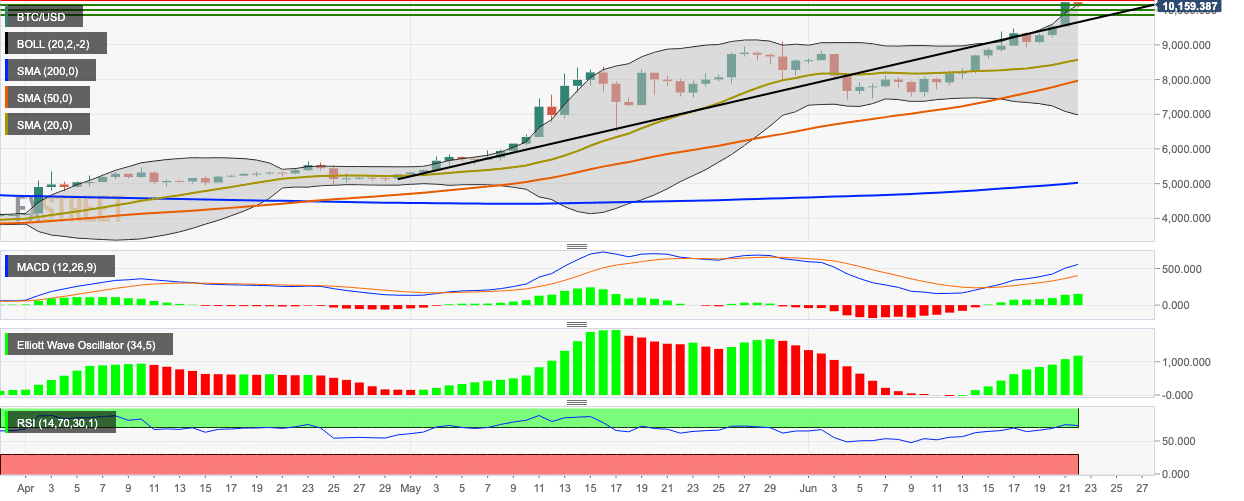
BTC/USD has crept out of the upper curve of the 20-day Bollinger band, which suggests that it is over-valued. The widening of the Bollinger band shows increasing market volatility. The market is trending above the 200-day simple moving average (SMA 200), SMA 50 and SMA 20 curve. This Friday’s session broke past resistance levels at $9,845, $10,025 and $10,175.
The moving average convergence/divergence (MACD) indicator has had eight bullish sessions in a row with increasing intensity. The Elliot oscillator has had 11 straight bullish sessions and the relative strength index (RSI) indicator is trending in the overbought zone at 76.56.
