- Litecoin correction further from the yearly highs to test $110 support.
- Technical indicators show that LTC has a bearish bias in the short-term.
LTC/USD buyers are fighting to hold to the shallow gains following the recovery staged from $110. In June, Litecoin corrected from $115 to new 2019 highs at $146. However, the negative pressure across the board last week culminated in declines below $120 key level before finding solace at $110.
The weekend sessions saw Litecoin correction from the lows around $110 where LTC/USD stepped above $130. Further upside correction zoomed past $135 and formed a high at $137.42. Luck diminishing buying power resulted in yet another ongoing slide towards $120 support.
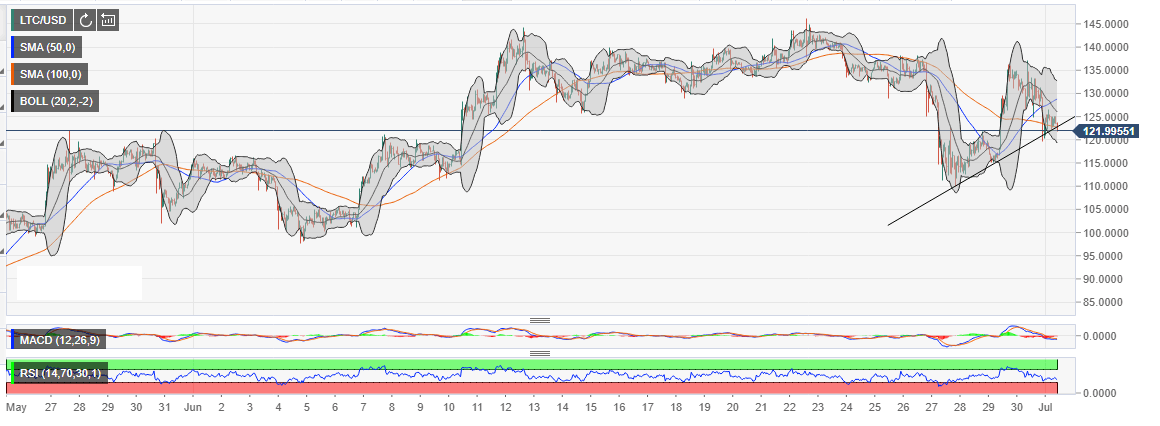
Meanwhile, the 100 Simple Moving Average (SMA) 1-h is offering support slightly above the Bollinger Band 1-h lower support. The bulls’ target at the moment is to ensure that $120 support is defended. This is essential because correction under this level could retest $110 level and breakdown towards $100.
On the flipside, technical indicators show that LTC has a bearish bias in the short-term. The Relative Strength Index (RSI), for instance, is moving south after being rejected from the overbought. The Moving Average Convergence Divergence (MACD) further emphasizes the impending declines with the increasing divergence.
LTC/USD 1-h chart