- BTC/USD consolidates in the middle of $10,000-$11,000 range.
- The strong resistance awaits BTC bulls on approach to $11,450.
Bitcoin (BTС) is changing hands marginally below $10,500. The first digital coin has lost over 1% since the beginning of the day and stayed unchanged from this time on Sunday. The price attempted to break above $11,000 on the weekend, but the momentum proved to be unsustainable as of yet.
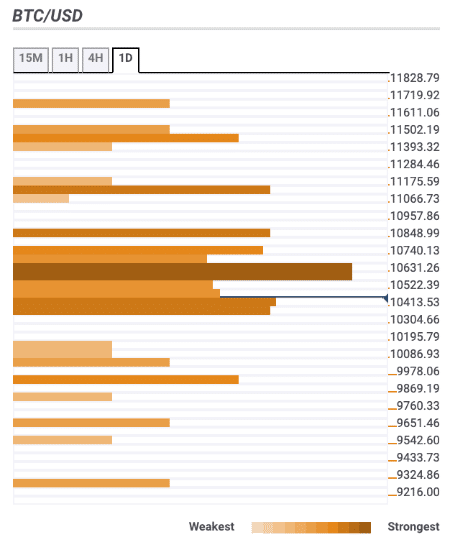
Bitcoin confluence levels
The Bitcoin (BTC) price is sidelined at this stage; however, the path to the North seems to be more difficult due to the strong resistance area located right above the current price.
Let’s have a closer look at the barriers that might influence Bitcoin’s movements in the short run.
Resistance levels
$10,600 – the resistance area goes up to $10,750, it includes the middle line of 4-hour Bollinger Band and the middle line of 1-hour Bollinger Band, 61.8% Fibo retracement weekly, 61.8% Fibo retracement daily.
$11,100 – the upper line of 4-hour Bollinger Band;
$11,450 – 23.6% Fibo retracement monthly
Support levels
$10,400 – the lower line of 1-hour Bollinger Band, SMA50 (Simple Moving Average) 4-hour, SMA100 1-hour;
$10,000 – psychological level, 38.2% Fibo retracement weekly
$9,650 – 23.6% Fibo retracement weekly;