- EOS/USD went down from $4.47 to $4.16 this Tuesday.
- The price is currently trending below the 20-day simple moving average (SMA 20), SMA 50 and SMA 200 curves.
EOS/USD has had an extremely bearish Tuesday, where the price plummeted from $4.47 to $4.16. In the process, it completely overwhelmed the gains it made this Monday, where it went up from $4.25 to $4.47, charting a bearish engulfing pattern. Looking at the hourly breakdown, we can see that the price had a bearish start to the day, where it went down from $4.47 to $4.38. The bulls then found support and took the price back up to $4.46. This was when the bears re-entered with a vengeance and pushed the price down hard to $4.16.
EOS/USD daily chart
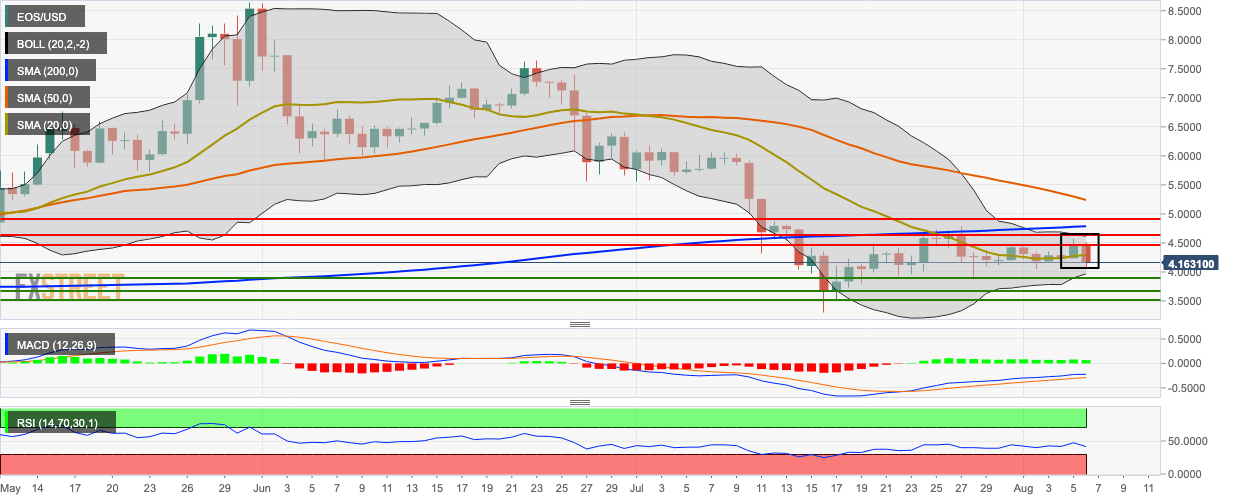
The price is currently trending below the 20-day simple moving average (SMA 20), SMA 50 and SMA 200 curves. The 20-day Bollinger jaw is narrowing, indicating decreasing market volatility. The moving average convergence/divergence (MACD) indicator shows decreasing bullish momentum and the relative strength index (RSI) indicator is trending around 42.15.
