- XRP is teetering at $0.2615 after losing 1% of its value on Friday.
- Ripple is clearly trading above a strong support area.
Ripple bulls are feeling paralyzed following the dive $0.24 support. While a recovery occurred from the support, it was not significant enough to reverse the bear momentum. Meanwhile, XRP is teetering at $0.2615 after losing 1% of its value on Friday.
XRP/USD daily chart

A glance at this chart shows an asset that is unable to forge the next move. With the Relative Strength Index (RSI) stuck at 30, sideways trading has more strength. Besides, the price is below the Moving Averages suggesting higher selling power. As long as the gap between the 50 Simple Moving Average (SMA) and the 100 SMA remains unchanged, XRP will be confined in a new range between $0.25 and $0.27.
XRP/USD 1-hour chart
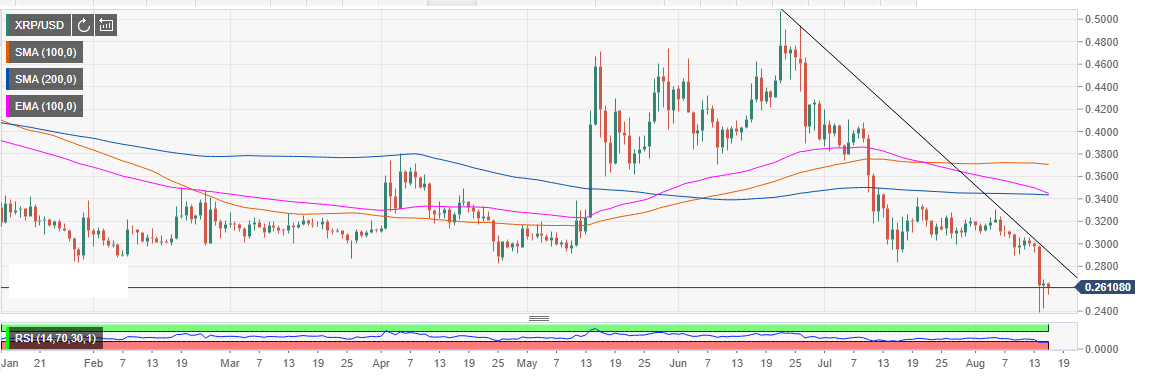
Ripple is clearly trading above a strong support area. This means that we are approaching the inflation point and the only way is up from the current levels. Correcting above $0.27 will open the road for gains above $0.30 stubborn resistance. Besides, in this short-term range, the RSI is above the oversold and gradually sloping upwards.
