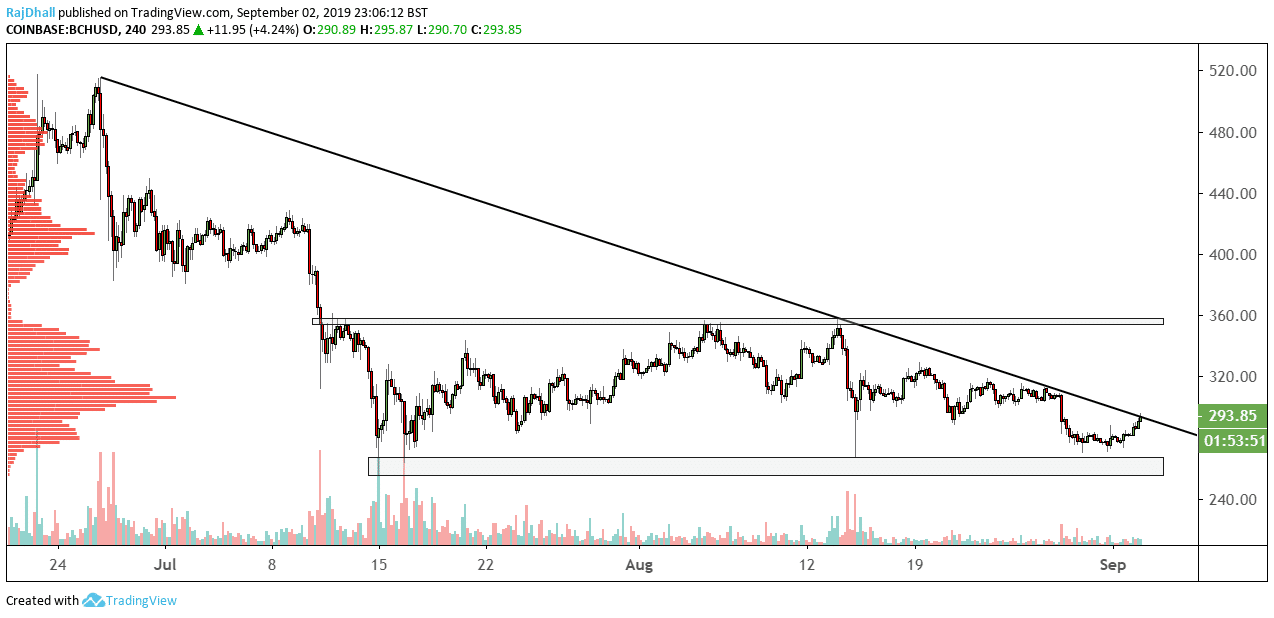
- Bitcoin Cash breaks a long term trendline from the 4-hour chart originating back in June.
- Today BTC/USD trades 4.4% higher as we head into the Asian session.
- The next price target on the lower timeframes is the 300 psychological level.
Bitcoin Cash is trading 4.4% higher today as general crypto sentiment carries all the major cryptocurrencies higher.
The 4-hour timeframe has a trendline originating on 26th June, with a downtrend that spanned a full two months.
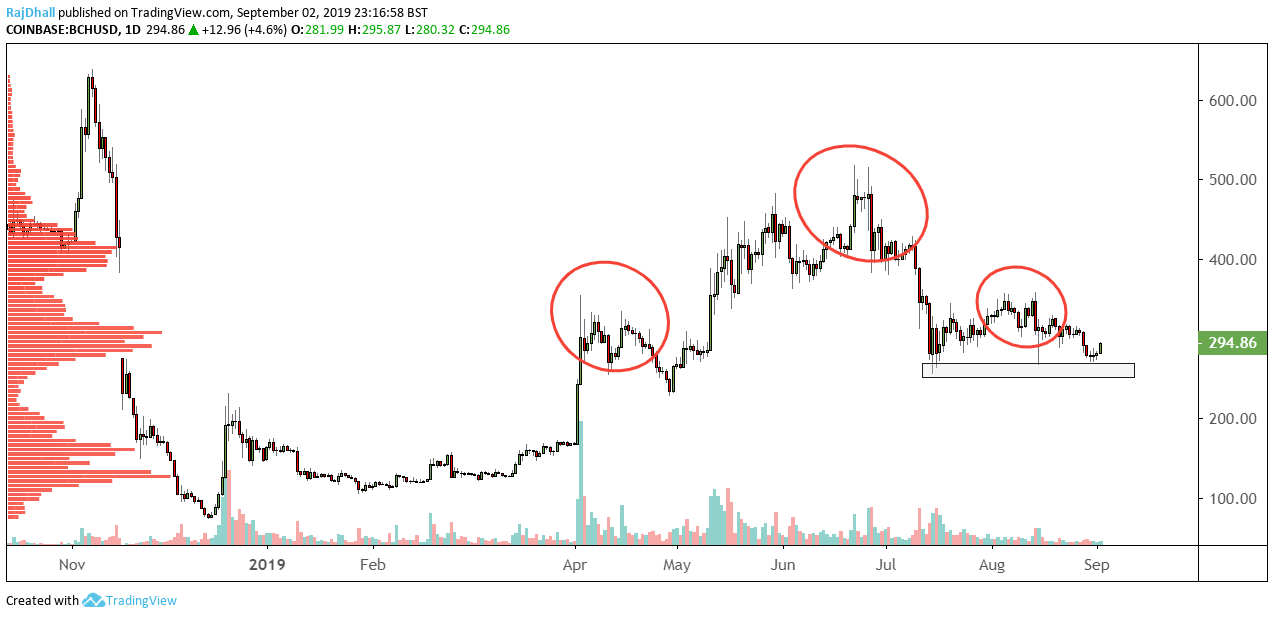
The daily chart below seems to show a rejection of the bearish head and shoulders pattern at the bulls came in ahead of the 255 support level.
If the 255 level broke to the downside that would have made the first lower high and lower low confirming a bearish market structure.
Now we have the opposite scenario, if 355 breaks to the upside a new higher low higher high will be made and we could get an uptrend back.
Back to the 4-hour chart above the mean value area stands close to 305 so it will be interesting to see if the price can break that level but 300 needs to be taken out first.