- BTC/USD went up from $9,773 to $10,390.30 this Monday.
- The daily confluence detector shows three healthy resistance levels on the upside.
Bitcoin had a monumental day this Monday. The bulls rallied together and spiked the price from $9,773 to $10,390.30 this Monday. The price has gone down a bit to $10,354 in the early hours of Tuesday. The hourly breakdown shows that the price flew up to $10,475 before the bears stepped in to check the price down to $10,354. The daily confluence detector shows three healthy resistance levels on the upside on the path back to $10,500.
BTC/USD daily chart
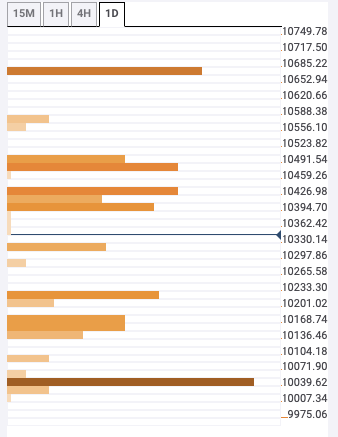
The daily confluence detector shows three resistance levels at $10,435, $10,490 and $10,680. $10,435 has the 50-day simple moving average (SMA 50) curve and the 1-hour previous high, while $10,490 has the 1-month Fibonacci 38.2% retracement level. The strongest resistance level is at $10,680, which has the 1-day pivot point resistance 1 and the previous week high.
On the downside, there are two support levels at $10,225 and $10,050. $10,225 has the 1-day Fibonacci 38.2% retracement level. The strongest support level is at $10,050, which has the 1-month Fibonacci 23.6% retracement level and the 1-day Fibonacci 61.8% retracement level.
