- Bitcoin trades 0.88% lower today as sentiment takes a hit.
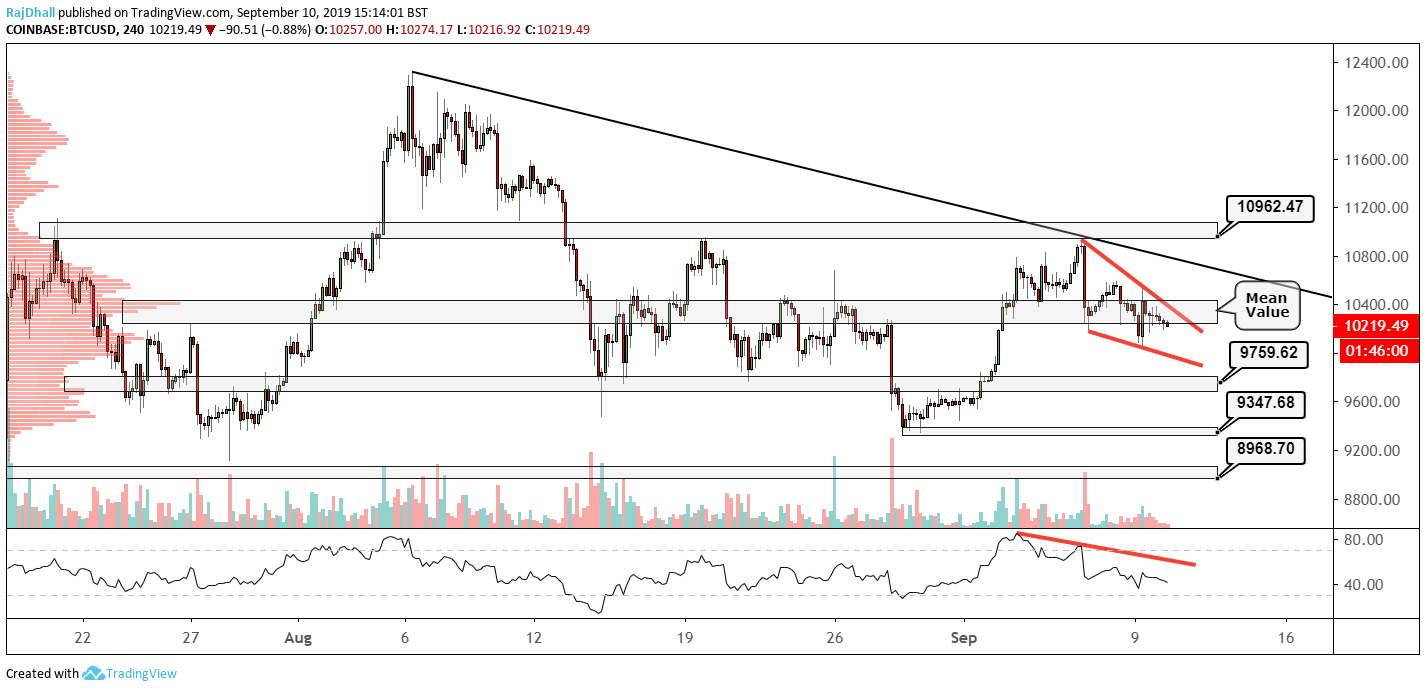
- There is a wedge type chart pattern on the 4-hour chart.
- If price breaks lower support is under 10k at 9,759.62.

Looking at the 4-hour price chart the lack of vol is clear as the market consolidates near the 10,200 level.
A wedge formation has formed now in a short term intraday price pattern and a break in either direction could give us some clues to the future path of price.
The 10k mark has been a great area of support in recent times and it could continue to be a sticking point.
On the RSI you can clearly see price is depressed. Although it has not reached oversold levels yet. I have marked a trendline on the RSI indicator and a break of this and the chart pattern will help the bullish cause.
On the topside, 11k has proven to be a formidable barrier for the BTC/USD pair and we have had two firm rejections one on August 19th and another on the 6th September.
10,425 remains the mean value area on the chart and the area where most contracts have changed hands on the Binance exchange. So keep an eye on what happens to the price if we get back to that level as it is clearly a price that traders are interested in.
Overall, bulls are looking for a bullish break of the chart pattern up to the trendline marked in black. If this fails the two support levels that come in to play are 9,347 and 8,968.
