- ETH/USD went down from $181.57 to $181 in the early hours of Saturday.
- The moving average convergence/divergence (MACD) shows sustained bullish momentum.
Ethereum has been trending horizontally for the last seven days. ETH/USD went down from $181.57 to $181 in the early hours of Saturday. Over the previous seven days, the price has been trending between $181.65 – $178.50. The hourly breakdown of Friday shows us that the price fell to $178.25 when it suddenly spiked to $181.60 within three hours. The price then met resistance and fell to $181.
ETH/USD daily chart
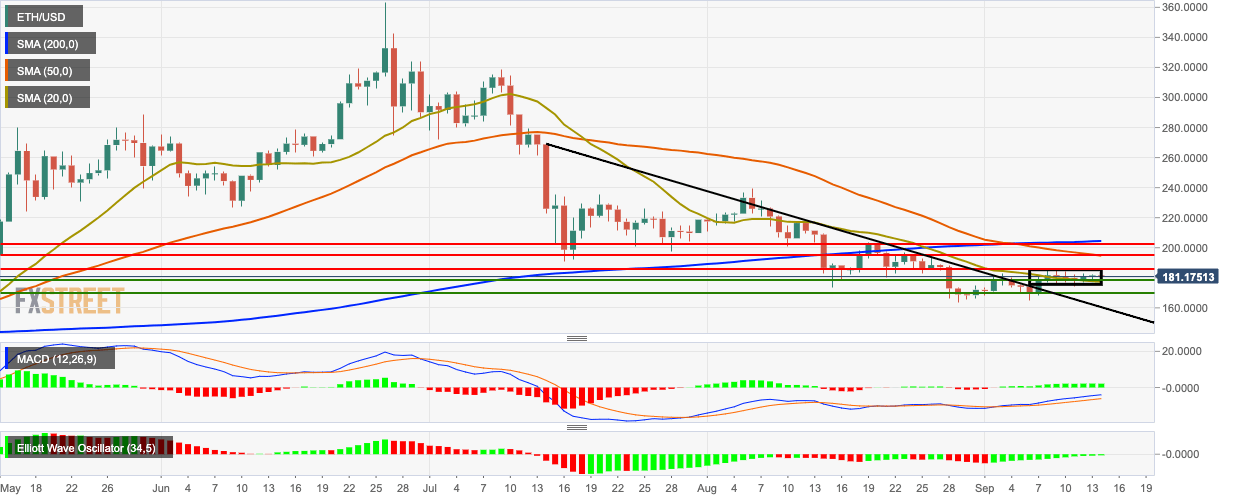
Nine days back ETH/USD had a bullish breakout from the downward trending line and has been plodding along horizontally since. The market has been trending below the 200-day simple moving average (SMA 200) and SMA 50 curves. ETH/USD has also found support at the SMA 20 curve. The moving average convergence/divergence (MACD) indicator shows sustained bullish momentum. The Elliott oscillator has had 13 straight bullish sessions.
