- Iota is currently trending in an upwards channel formation.
- The latest price session has gone up from $0.262 to $0.268.
Iota has managed to have six straight bullish days and is trending in an upwards channel formation. The latest price session has gone up from $0.262 to $0.268. The hourly breakdown shows that this Tuesday, the price had gone up to $0.264, where it met resistance and trended horizontally. The bears then stepped in and dropped the price to $0.261 as Tuesday came to a close. The bulls have since started the day strong and managed to take the price up to $0.268.
IOT/USD daily chart
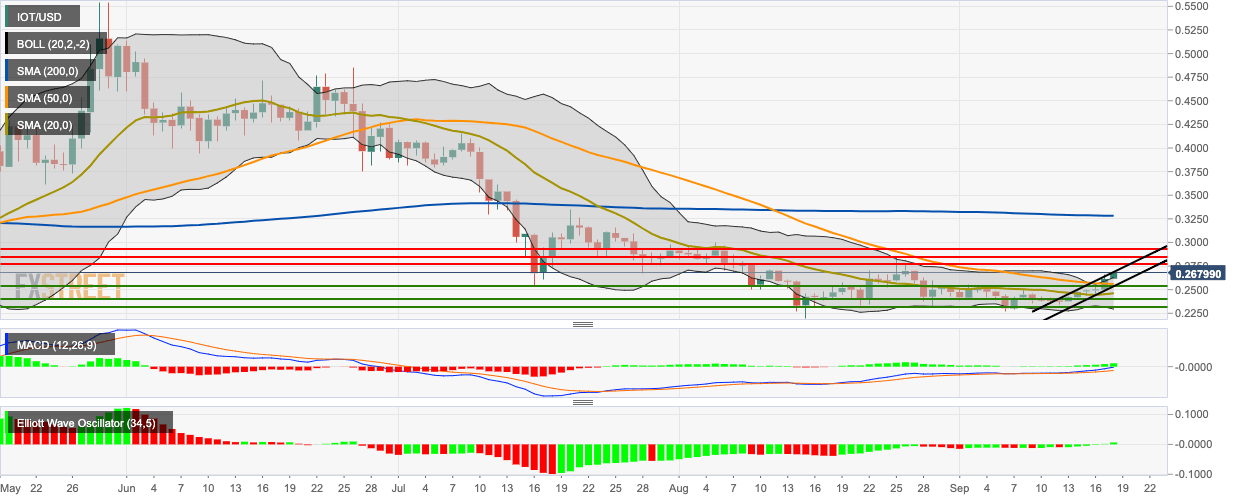
The two latest sessions have taken the price of Iota above the 20-day Bollinger band, indicating that the asset is overpriced and may face bearish correction soon. IOT/USD is also trending above the 20-day Simple Moving Average (SMA 20) and SMA 50 curves. The Moving Average Convergence/Divergence (MACD) indicator shows increasing bullish momentum, while the Elliott Oscillator shows six straight bullish sessions of growing intensity.
