- A move above $200.00 will improve the short-term technical picture.
- The significant support is created on approach to 190.00.
The second-largest cryptocurrency with the current market capitalization of $21.5 billion has been moving down in sync with the market. At the time of writing, ETH/USD is hovering around $199.00, off the intraday high touched at $202.70. The coin has lost nearly 5% on a day-on-day basis and about 1% since the beginning of Monday.
Ethereum’s long-term technical picture
Looking technically still stays inside the upper part of the daily Bollinger Band; however, a sustainable move below critical $200,00 which bodes ill for Ethereum bulls. Strong support is now created by a combination of SMA50 (Simple Moving Average) and the middle line of a Bollinger Band on a daily chart. Once it is cleared, the downside pressure may increase with the next focus on $190.00 and $187.20 (SMA200 four-hour chart).
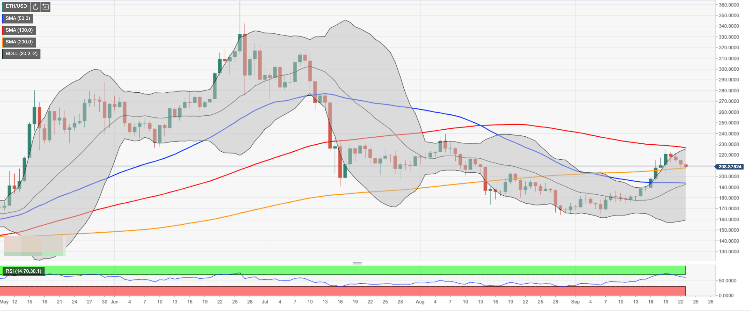
On the upside, we will need to see a sustainable move above $200.00 to mitigate the initial bearish pressure. Once it is out of the way, the next barrier at $209.00 will come into focus. It is created by a confluence of SMA50 and the middle line of Bollinger Band on a four-hour chart. The next resistance awaits us on approach to $220.00 (the upper line of four-hour Bollinger Band).
ETH/USD, a four-hour chart