- Bitcoin price is trading marginally in the red down some 1.10% in the second half of the session.
- BTC/USD bears firmly breached the psychological $10,000 mark, which has created further vulnerabilities to the downside.
- The next major level of support is seen at $9500, which is being tested by the bears.
BTC/USD daily chart
- Buyers are heavily attempting to defend the $9500 area, following to breakdown of $10,000.
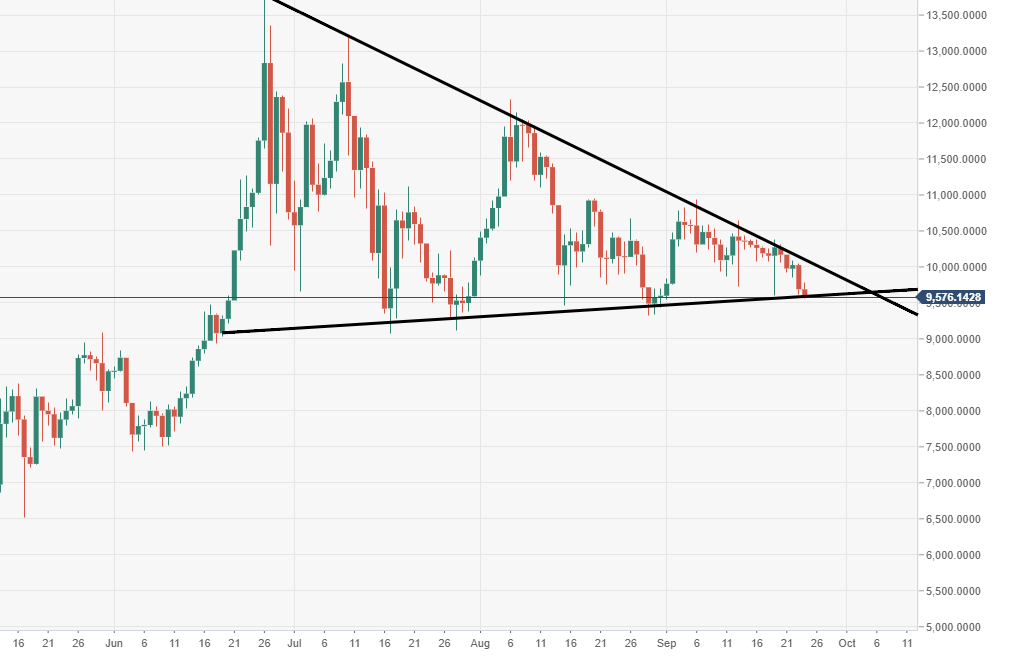
BTC/USD 60-minute chart
- A fresh wave of selling pressure has been triggered to the downside after a bearish pennant breach was seen via the 60-minute.

Spot rate: 9891.15
Relative change: -1.30%
High: 9776.78
Low: 9560.61
