- Bitcoin may be vulnerable to massive losses once $8,000 is broken.
- Critical support is created by SMA100 on a weekly chart.
Bitcoin (BTC) has returned to the levels, registered at the beginning of the week. At the time of writing, the first digital coin is changing hands at $8,116, trading with short-term bearish bias amid decreasing volatility. However, the situation may change drastically, once BTC/USD dives under $8,000.
Should this happen, the downside momentum will gain traction with the next focus on SMA100 (Simple Moving Average) on a weekly chart $7,770 followed by the lowest level of the current week at $7,700.
This area stopped the sell-off twice recently, on September 26 and September 30. Once it is out of the way, the bears will push the price towards the next critical barrier of $7,450m created by the middle line of the Bollinger Band on a weekly chart. The next support comes at $7,200 ( the lower line of a daily Bollinger Band).
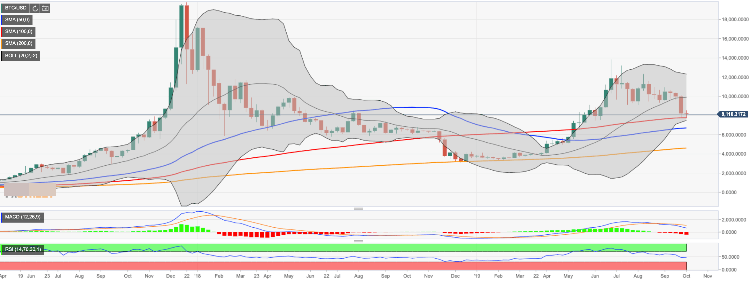
On the upside, BTC/USD recovery is limited by SMA200 (Simple Moving Average) currently at $8,500. The coin been lingering below this line since September 26, which is a clear a bearish signal. We will need to see a sustainable move above this handle to mitigate the pressure and allow for an extended recovery towards the next strong barrier of $9,000.
BTC/USD, one-week chart