- NEO has been one of the best-performing altcoins.
- The upside momentum has faded away on approach to a strong barrier.
NEO, now the 18th largest coin with the total market value of $770 million, topped at $13.45 on Monday. At the time of writing, NEO/USD is changing hands at $10.96, down 8.8% on a day-to-day basis. Since the beginning of Tuesday, the coin has gained 2.2% and recovered from the intraday low of $10.64.
Despite the retreat, NEO remains one of the best performers in recent days. Since October 24 the coin has gained over $4 or nearly 60% of its value.
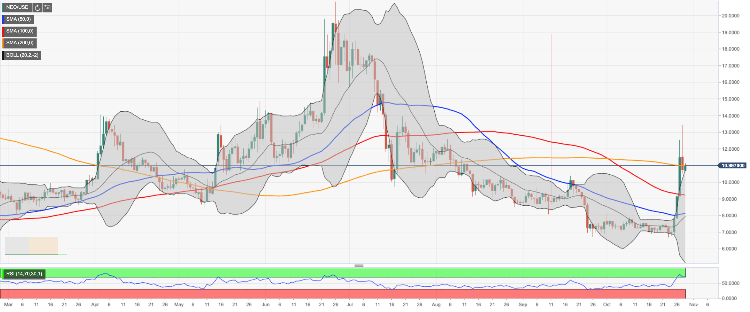
NEO/USD, the technical picture
Looking technically, NEO/USD returned to the area below the resistance created by SMA200 (Simple Moving Average) daily at $11.00. This is a strong barrier that needs to be taken out for the upside to gain traction. Once it happens, $15.50 (October 27 high) will come into view followed by the recent top at $13.45.
On the downside, the initial support is created by psychological $10.00. A sustainable move below this handle will open up the way towards SMA100 daily at $9.23. The next support awaits NEO on approach to $8.00 (SMA50 daily). If it is broken, the sell-off may continue towards $7.40 (the middle line of the Bollinger Band on a daily chart).
NEO/USD, the daily chart