- The confluence detector shows healthy resistance levels at $9,220 and $9,165.
- The support stack lies from $8,985-$9010, which keeps the price up.
BTC/USD is on course for charting four consecutive bearish days. So far this Thursday, BTC/USD has fallen from $9,162.45 to $9,093. The hourly BTC/USD chart shows that the price fell to $9,046, where it found intraday support and then jumped up. The price went up and found intraday resistance at $9,225.65 and then dropped to $9,093. The confluence detector shows two healthy resistance levels at $9,220 and $9,165. On the downside, there is a support stack from $8,985-$9010, which keeps the price up. There is another strong support level at $8,950.
BTC/USD daily confluence detector
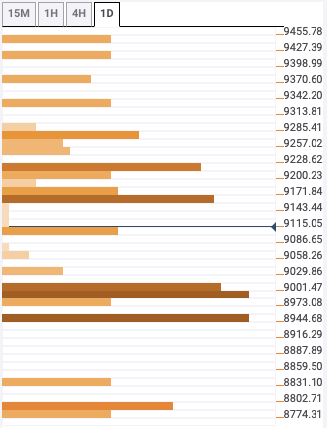
Looking at the resistance levels, $9,220 has the one-week Pivot Point resistance one and one-hour previous high. $9,165 has the four-hour previous low, one-hour previous low, five-day Simple Moving Average (SMA 5), one-hour Bollinger band middle curve and SMA 10.
On the downside, the $8,985-$9010 stack has the one-day previous low, SMA 200 and one-day Pivot Point support one. $8,950 has the one-month Fibonacci 38.2% retracement level.
