- Bitcoin price is trading in the negative territory, down some 0.30% in the second half of the session.
- BTC/USD is running towards its fifth consecutive session in the red, as the price continues to consolidate.
- Big resistance barrier should be noted at $9500, a breakdown here could provide a fresh wave to buying pressure.
BTC/USD daily chart
BTC/USD price action via the daily chart view continued to move within a potentially bullish flag structure.
BTC/USD 60-minute chart
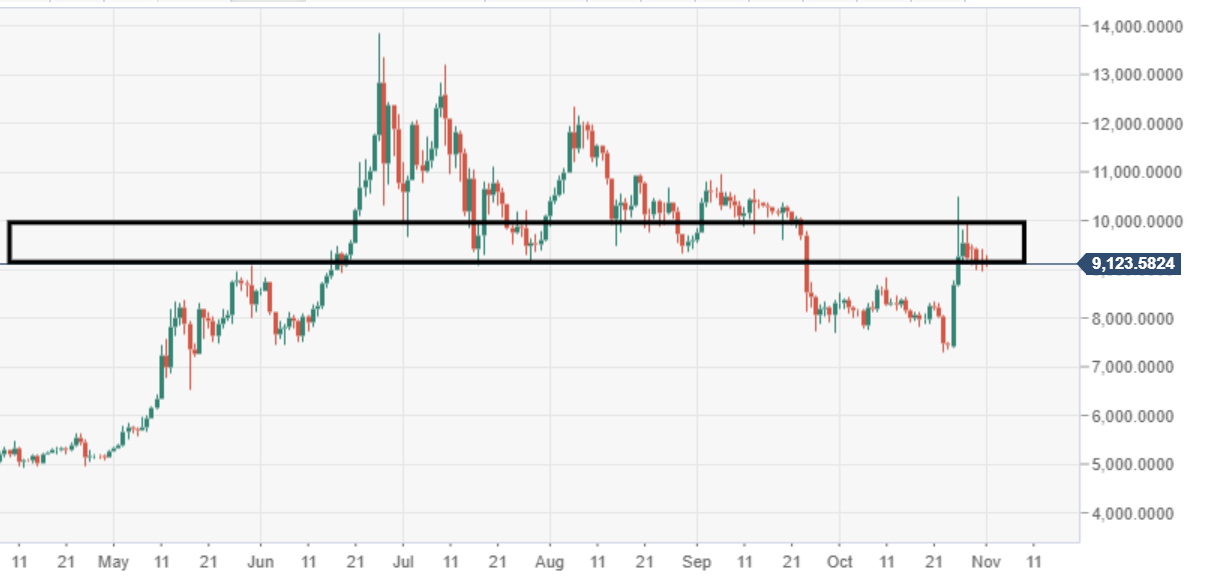
Price action is narrowing within a range-block formation, subject to a breakout.

Spot rate: 9,122.02
Relative change: -0.35%
High: 9,304.68
Low: 9,057.55
