- BTC/USD went up from $9,155.70 to $9,254.85 this Friday as bulls roared back.
- On the downside, there is a strong support stack from $9,170-$9,200.
BTC/USD bulls roared back this Friday following four bearish days in a row. The price of BTC/USD went up from $9,155.70 to $9,254.85 this Friday. Currently, the sellers have edged out the buyers to take the price of Bitcoin down to $9,250. The hourly BTC/USD chart shows us that BTC/USD found intraday support at $9,095 this Friday and bounced up to $9,279.25, before settling around $9,250.
BTC/USD daily confluence detector
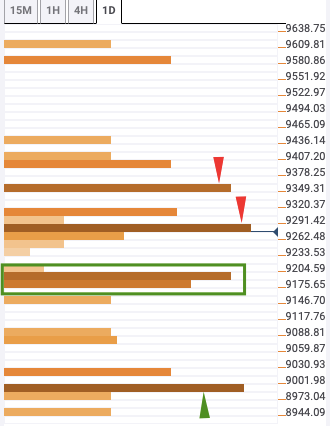
There are two resistance levels of note at $9,275 and $9,360. If the bulls overcome these, then BTC/USD will be able to re-enter the $9,500-zone. $9,275 has the five-day Simple Moving Average (SMA 5) and one-month Fibonacci 38.2% retracement level. $9,360 has the one-week Fibonacci 61.8% retracement level and four-hour Bollinger Band upper curve.
On the downside, there is a stack of support from $9,170-$9,200 and another healthy level at $9,000. $9,170-$9,200 has the SMA 5, SMA 10, SMA 50, SMA 100, SMA 200, one-hour Bollinger Band middle curve, four-hour previous low and four-hour Bollinger band middle curve. Finally, $9,000 has the one-day previous low.
