Home Bitcoin technical analysis: BTC/USD the big barrier of $9100 – 9500 is being tested
Crypto News

Bitcoin technical analysis: BTC/USD the big barrier of $9100 – 9500 is being tested

  • Bitcoin  price is trading in negative territory, down some 1.45% in the second half of the session.  
  • BTC/USD price action is further narrowing within a pennant structure, subject to a breakout.  
  • Big supply area is seen running from $9100-9500, ahead of the psychological  $10,000 mark.


BTC/USD weekly chart

The region of $9000 to $9500 remains a difficult hurdle for the bulls to break down.  

BTC/USD daily chart

BTC/USD price action via the daily chart view continues to narrow within a bullish pennant, subject to a breakout.  
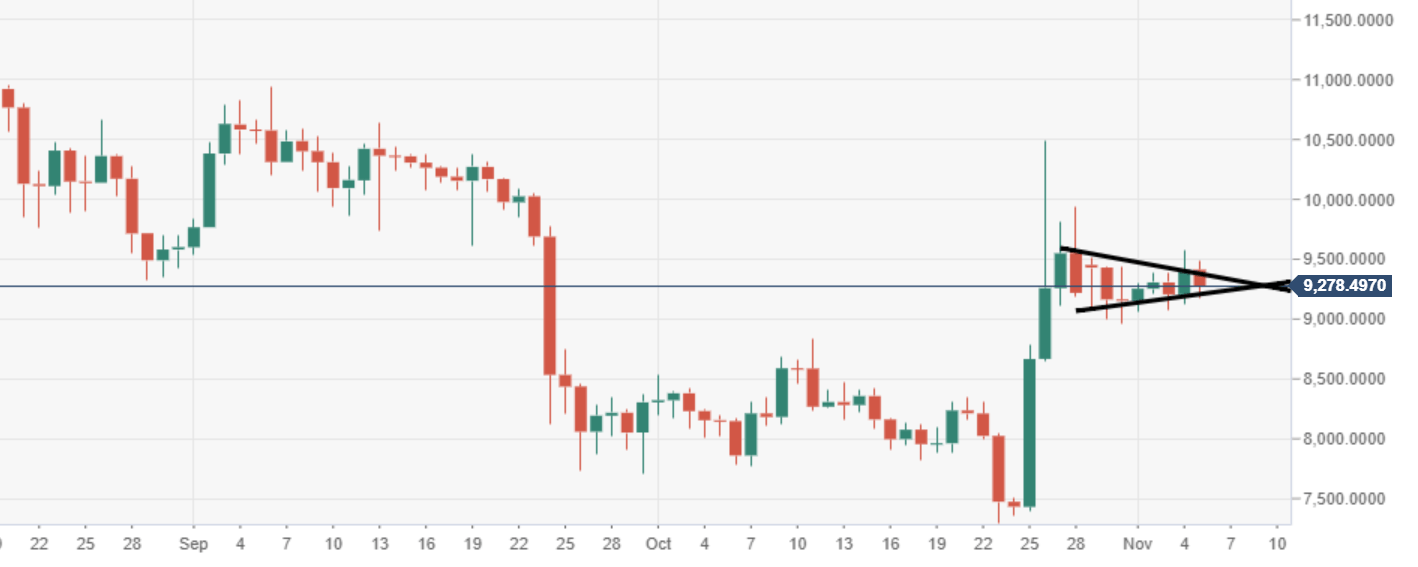
 

Spot rate:                    9,277.10

Relative change:        -1.40%

High:                           9,487.54

Low:                            9,176.08


FX Street

FX Street

FXStreet is the leading independent portal dedicated to the Foreign Exchange (Forex) market. It was launched in 2000 and the portal has always been proud of their unyielding commitment to provide objective and unbiased information, to enable their users to take better and more confident decisions.