- Ethereum price is trading in the red, down 2.40% the session on Thursday.
- ETH/USD is back to moving within a bearish pennant structure, subject to further potential downside pressure.
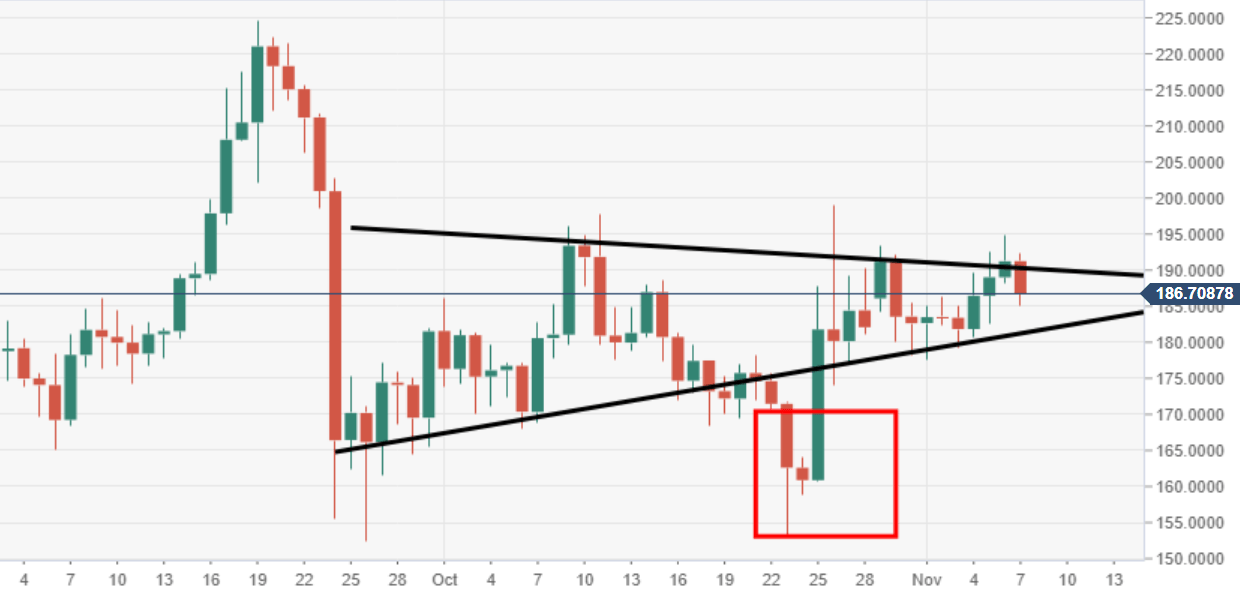
- The bears failed to break down the strong barrier heading into $200.
ETH/USD daily chart
Following a fakeout period between 23-24 October, ETH/USD is back within the confinements of a bearish pennant.
ETH/USD 60-minute chart
.Near-term price action is moving within a descending channel structure
 .
.
Spot rate: 189.45
Relative change: -2.40%
High: 192.31
Low: 184.99
