- BTC/USD has recovered from the intraday low, still under pressure.
- Bears may have an upper hand in the short-run.
BTC/USD reached the bottom at $8,598 on Monday and recovered to $8,700 by press time. Despite the recovery, BTC/USD is trading with 3.5% of losses since the beginning of the day.
Read also: Crypto Today: Transition week to a tokenized world
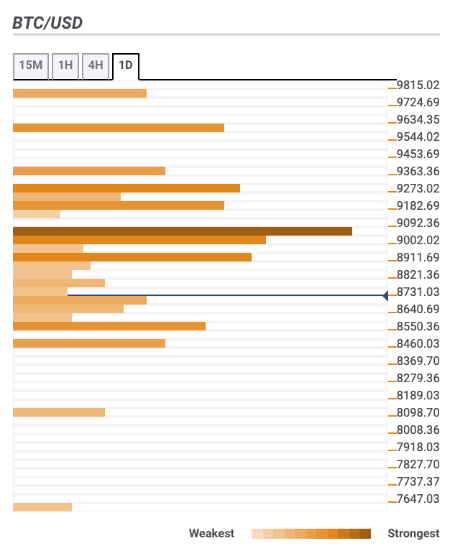
Bitcoin confluence levels
Looking technically, BTC/USD may be vulnerable to further losses as there are quite a few important barriers clustered above the current price. The retreat looks like a path of least resistance, though a sustainable move above $9,000 will negate the bearish scenario.
Let’s have a closer look at the technical levels that may serve as resistance and support areas for the coin.
Resistance levels
$$8,850-8,900 – SMA50 (Simple Moving Average) 1-hour, SMA200 15-min, the middle line of the daily and 4-hour Bollinger Bands, SMA10 4-hour, 61.8% Fibo retracement daily, 23.6% Fibo retracement weekly
$9,050 – 23.6% Fibo retracement daily, 38.2% Fibo retracement daily, the highest level of the previous four hours, SMA5 daily
$9,250 – SMA100 4-hour, 61.8% Fibo retracement weekly, 38.2% Fibo retracement monthly
Support levels
$8,550 – 61.8% Fibo retracement monthly, 161.8% Fibo projection daily
$8,450 – Pivot Point 1-day Support 2, Pivot Point 1-week Support 1
$8,050 – Pivot Point 1-week Support 2.