BTC/USD Technical Analysis: Bitcoin is looking bullish – Watch for a break of this level
Bitcoin is looking to push higher on the hourly chart below.
The chart highlights the inverse head and shoulders formation.
Now the 7,676 resistance level is in focus as if the price breaks the level it will create a new wave high.
-637105529387306787-637105687927708072.png)
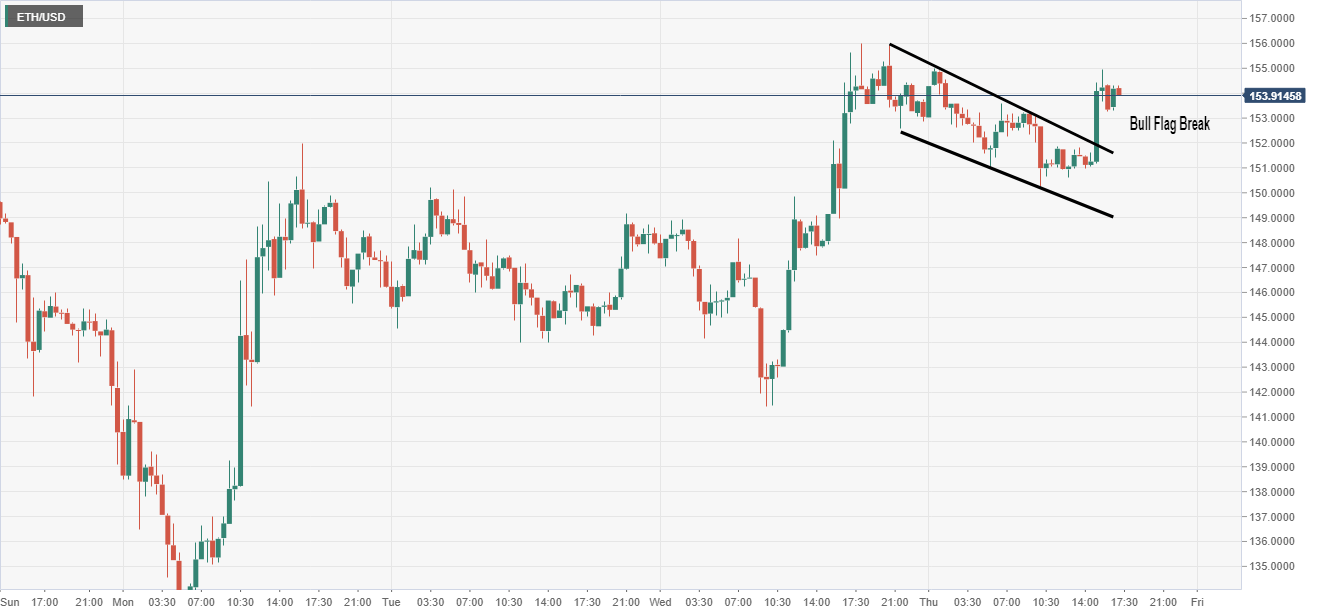
ETH/USD Technical Analysis: The technical pattern break sends prices higher
Ethereum has broken the bull flag chart pattern on the 30-minute chart.
The pole of the formation kicked off on Wednesday after the price hit a low of 141.44.
Sometimes patterns can come back to retest so be aware but the initial signs are good.
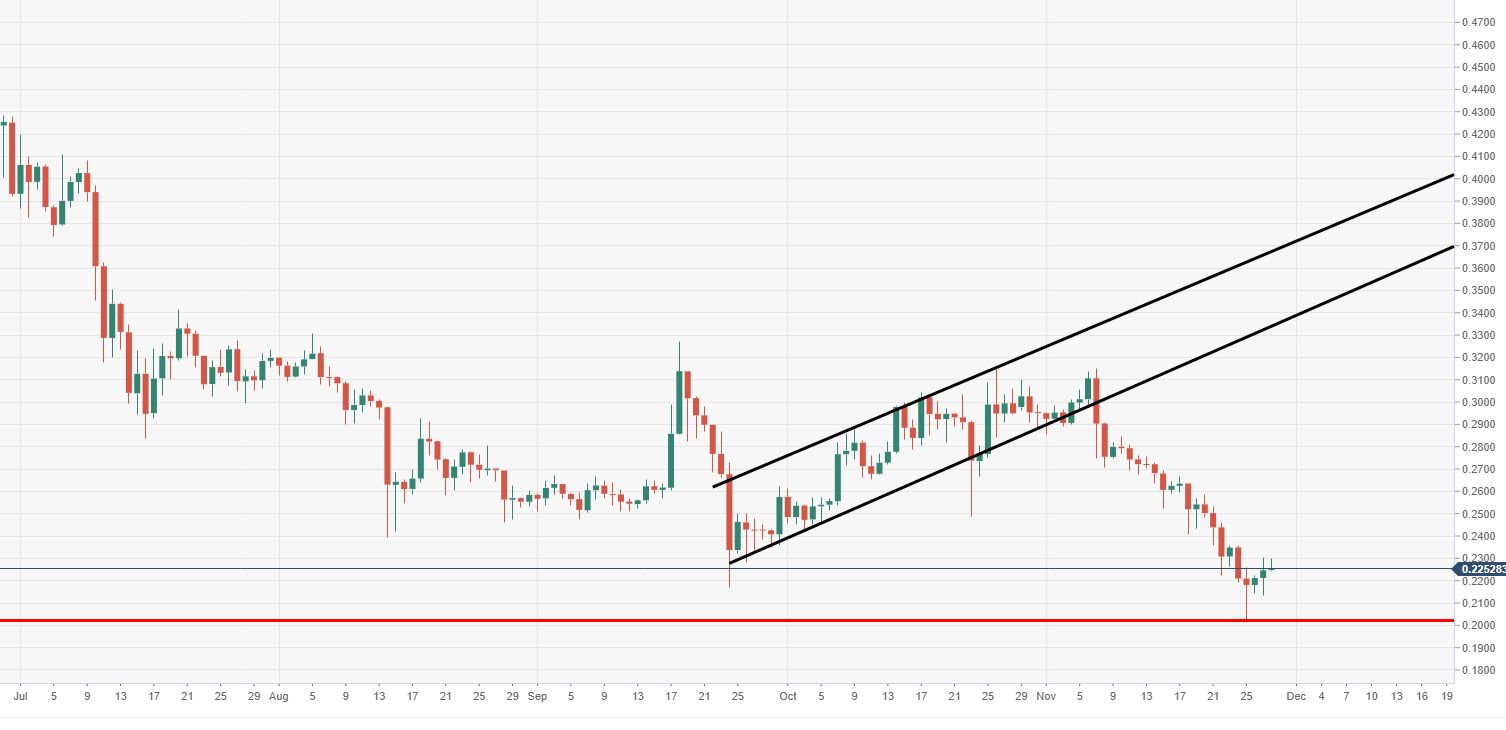
Ripple’s XRP technical analysis: XRP/USD attempting to stage rebound after bouncing off critical $0.2000 mark
Ripple’s XRP price is trading in the green by some 1.30% in the session on Thursday.
XRP/USD has seen a critical bounce ahead of the $0.2000 being breached to the downside.
The next major barrier to the upside is seen at the psychological $0.2500 price mark.