Home Ripple’s XRP technical analysis: XRP/USD weekly candlestick forming a potential reversal hammer
Crypto News

Ripple’s XRP technical analysis: XRP/USD weekly candlestick forming a potential reversal hammer

  • Ripple’s XRP price is trading in the green by some 3.00% in the session on Friday.
  • XRP/USD has a task of attempting smash through resistance ahead of the $0.2500 mark.  
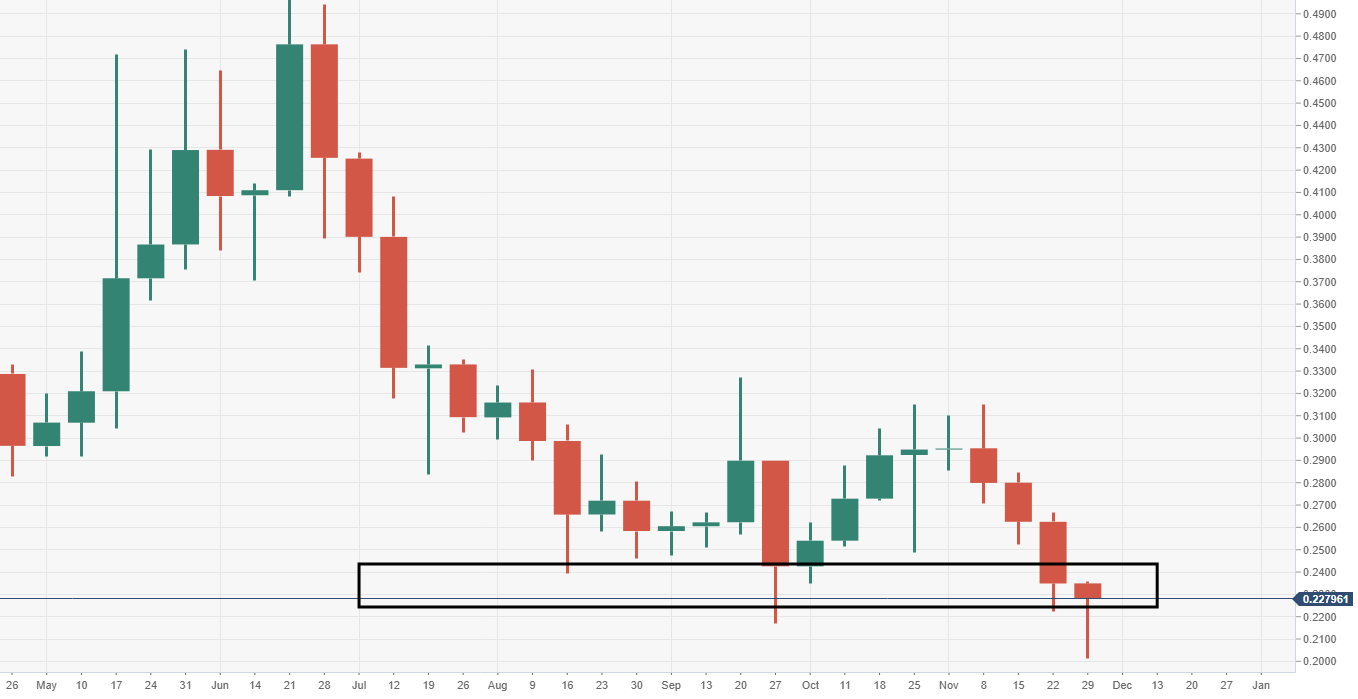
  • The current candlestick via the weekly is pushing for a potential reversal hammer closure.  


XRP/USD weekly chart

The bulls will be attempting to snap a four consecutive week of losses run, where the price has dropped from $0.3100 down to $0.2000.  
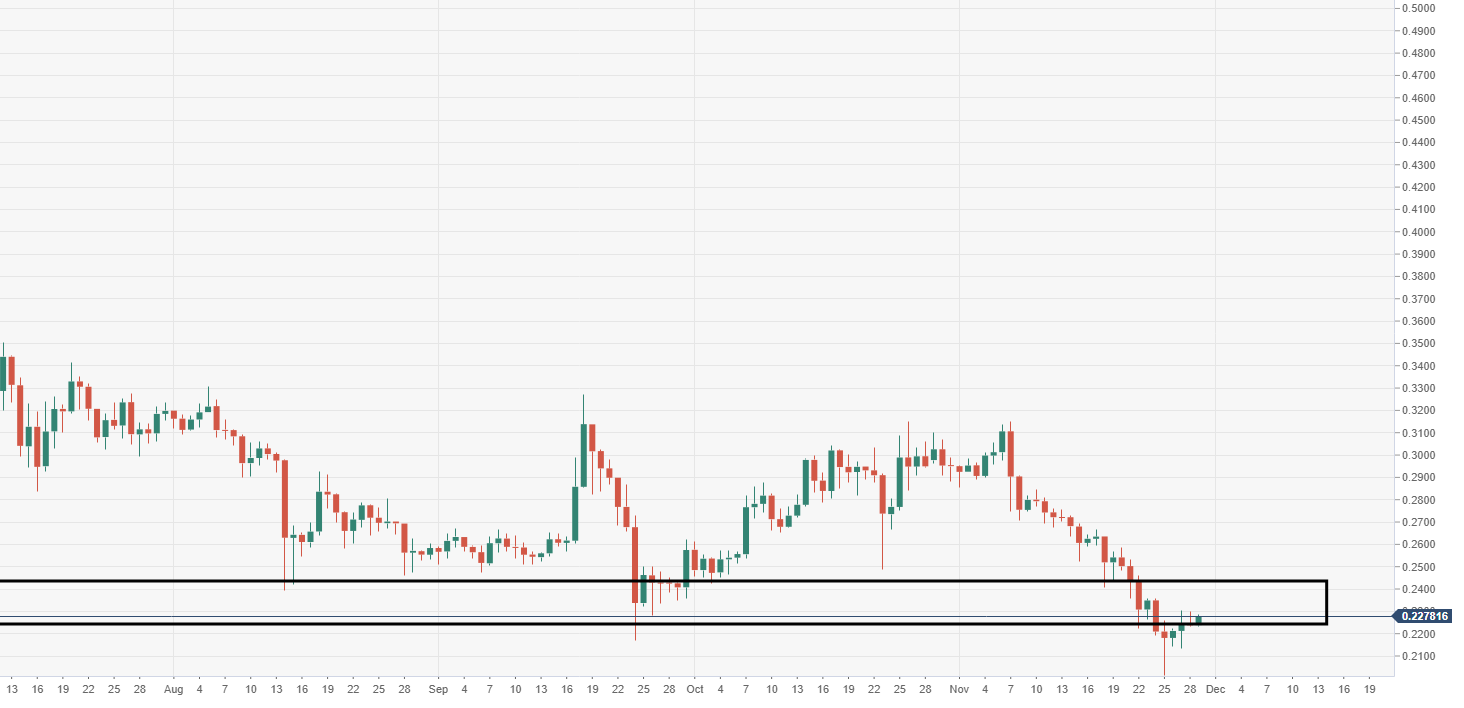
XRP/USD daily chart

Bulls are attempting to break down a heavy supply region seen running from $0.2300-0.2500.  

Spot rate:                0.2305                        

Relative change:   +3.00%

High:                       0.2331      

Low:                       0.2232


FX Street

FX Street

FXStreet is the leading independent portal dedicated to the Foreign Exchange (Forex) market. It was launched in 2000 and the portal has always been proud of their unyielding commitment to provide objective and unbiased information, to enable their users to take better and more confident decisions.