- The coin has lost over 5% in recent 24 hours.
- The bearish scenario looks highly likely at this stage.
Tezos (XTZ) is one of the worst-performing coins on a day-to-day basis, according to the statistics provided by CoinMarketCap. The 15th largest digital asset with the current market capitalization of $810 million has lost over 5% of its value in recent 24 hours. At the time of writing, XTZ/USD is changing hands at a critical $1.200.
Tezos, the technical picture
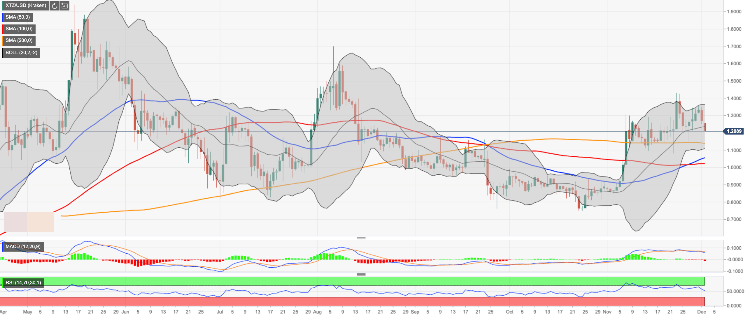
Looking technically, XTZ/USD has broken below the middle line of the daily Bollinger Band at $1.2367. As the selling pressure has been growing, the price came close to a psychological $1.2000. Once it is out of the way, the downside is likely to gain traction with the next focus on SMA200 (Simple Moving Average) at $1.389, followed by the lower line of the daily Bollinger Band at $1.1000.
Considering the downward-looking RSI (Relative Strength Index) on a daily chart, the probability of a bearish scenario is high at this stage.
Meanwhile, a sustainable move above $1.2300 will help mitigate the initial bearish pressure and create a bullish impulse. The next resistance awaits us on approach to $1.2440 (SMA100 4-hour). If it is v=broken, the recovery may bee extended towards $1.2750 (SMA50 4-hour) and psychological $1.3000.
XTZ/USD, the daily chart