- Healthy support level at $7,245 is holding the price up.
- Strong resistance levels are at $7,370 and $7,570.
Bitcoin charted its third consecutive bearish day after failing at the $7,766.25 line. BTC/USD has dropped from $7,410.40 to $7,345.85. The hourly chart for Monday shows us that the price fell to $7,229.25, where it found intraday support and bounced up to $7,315. After trending horizontally for a bit, BTC/USD jumped up to $7,345.85. As per the daily confluence detector, strong resistance levels lie at $7,370 and $7,570. On the downside, $7,245 has a healthy support level.
BTC/USD daily confluence detector
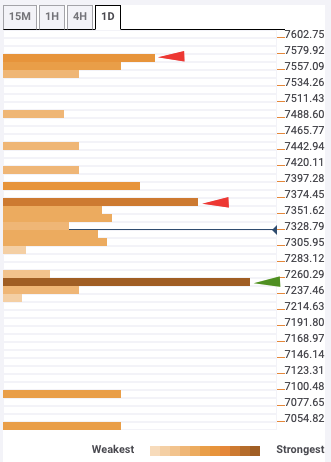
$7,370 has the one week and one day Fibonacci 38.2% retracement levels, while $7,570 has the one-day Previous High and one-day Pivot Point resistance one. The $7,245 support level has the one-day Pivot Point support one and one-month Fibonacci 23.6% retracement level.
