- XRP/USD bears aiming for the $0.20 level.
- Elliott Oscillator has had a red session after five straight green sessions.
XRP/USD dropped from $0.220 to $0.213 so far this Wednesday. The bears are aiming for the $0.20-level. The hourly breakdown for Tuesday and Wednesday shows us that XRP/USD was trending in a narrow range between $0.22 and $0.219 before it fell from $0.22 to $0.212 in a seven-hour time period.
XRP/USD daily chart
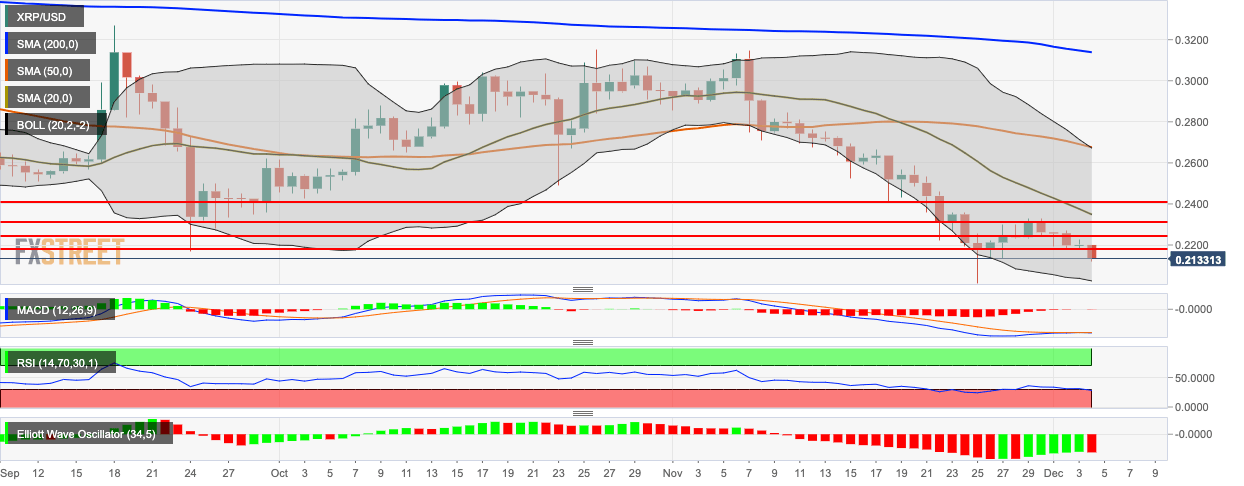
The daily chart is floating below the 200-day Simple Moving Average (SMA 200), SMA 50 and SMA 20 curves. The Elliott Oscillator has had a red session after five straight green sessions. The Relative Strength Index (RSI) indicator has crept inside the oversold zone, while the Moving Average Convergence/Divergence (MACD) indicates increasing bearish momentum, following a period of convergence.
