- The coin has lost over 8% in recent 24 hours.
- The bearish potential is not exhausted yet.
Tezos (XTZ) reversed the gains from the previous days. XTZ/USD is changing hands at $1.45, off Monday’s high of $1.6513. From the best-performer, the coin turned into the biggest loser. The coin is down over 8% on a day-to-day basis amid strong bearish pressure, caused mostly by technical factors.
Tezos settled on the 11th place with the current market value of $964 million. An average daily trading volume has reached $66 million
Tezos, the technical picture
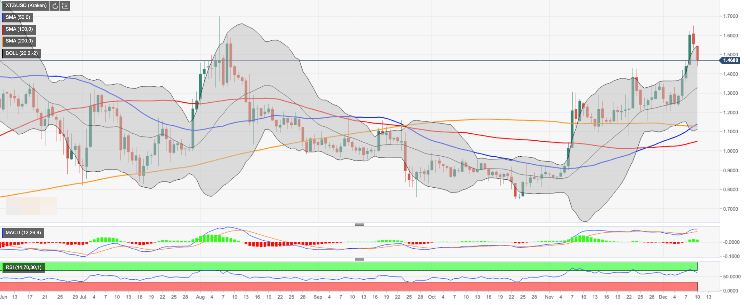
While the retreat is a natural development of an overexaggerated growth. The daily RSI (Relative Strength Index) reversed from overbought territory and now points downwards. It means that the coin may continue the downside correction in the near term future. The first support is created by the middle line of the daily Bollinger Band at $1.32. If it is broken, the sell-off may continue towards $1.23.
On the upside, the local resistance is created by $1.54.This barrier is created by the upper line of the daily Bollinger Band. We will need to see a sustainable move above this handle for the upside to gain traction with the next focus on $1.65. The next hurdle awaits us at $1.7000.
XTZ/USD, the daily chart